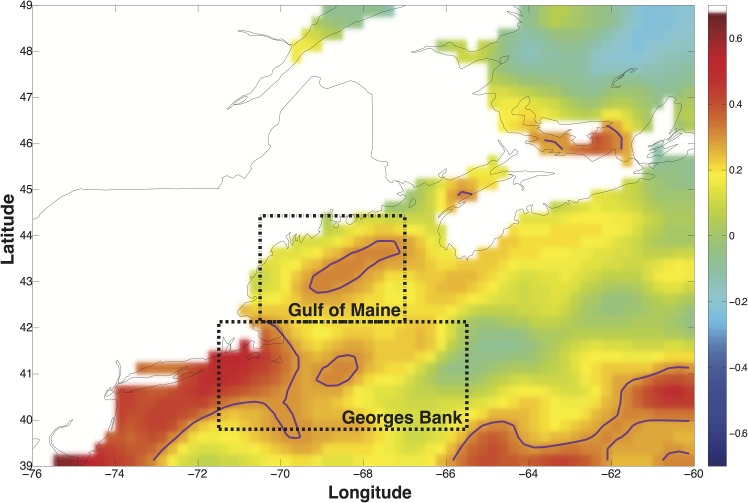
Fig 1. Winter NAO and Sea Surface Temperature (SST) correlation.
The map shows the grid-cell-level correlation between winter (DJFM) NAO and SST from 1982 to 2013 with a quadratic time trend removed (see SI). Purple contour lines indicate areas where correlation p-value<0.1. Dashed boxes indicate the statistical area for the Gulf of Maine and Georges Bank stocks. Grid resolution is 0.25 degrees latitude x 0.25 degrees longitude. Correlation values in bar at right of map.

