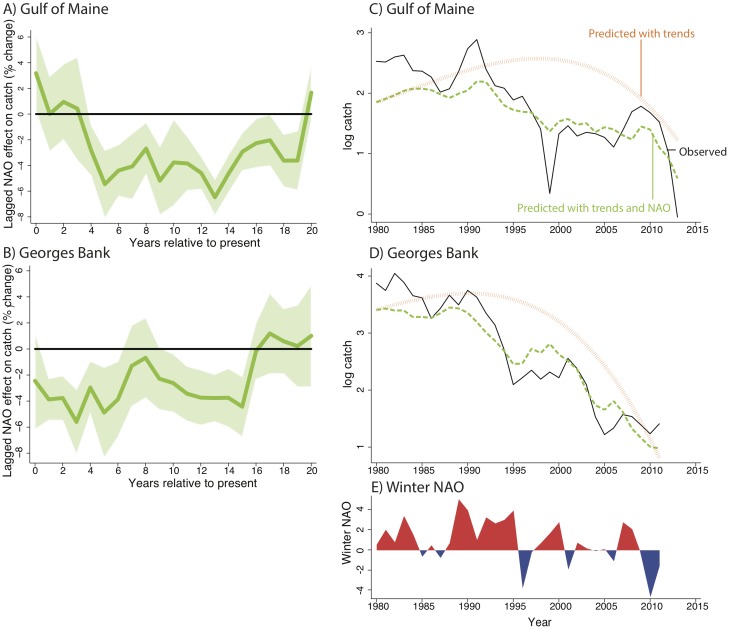
Fig 3. Effects of current and past NAO on cod catch.
Panels (A) and (B) show regression coefficients from a multiple regression model of commercial cod catch on current and past NAO variability for the Gulf of Maine and Georges Bank stocks, respectively. The x-axis represents the number of years prior that a 1-year increase in NAO occurred. 90% confidence interval shown. Panels (C) and (D) show observed log catch (black line), predicted log catch using only secular time trends (orange line), and predicted log catch using both secular time trends and observed NAO (green line). Panel (E) shows observed NAO variation.

