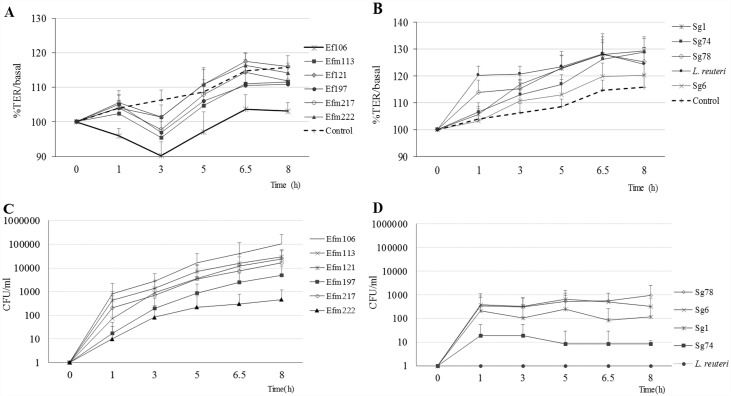
Fig 1.
E. faecium (A) and S. gallolyticus (B) TER response. TER values were monitored before and after infection throughout an 8 h period and results were expressed as percentages of mean TER (±SD) at each time point in relation to basal value (before infection). E. faecium (C) and S. gallolyticus (D) translocation across an epithelial monolayer. Bacterial translocation was expressed as mean (± SD) colony forming units (CFU/ml). Translocation results for E. faecium strains were compared to Efm222, *p< .05. These figures summarize the results of three independent experiments comprising 3–6 replicates of each isolate.

