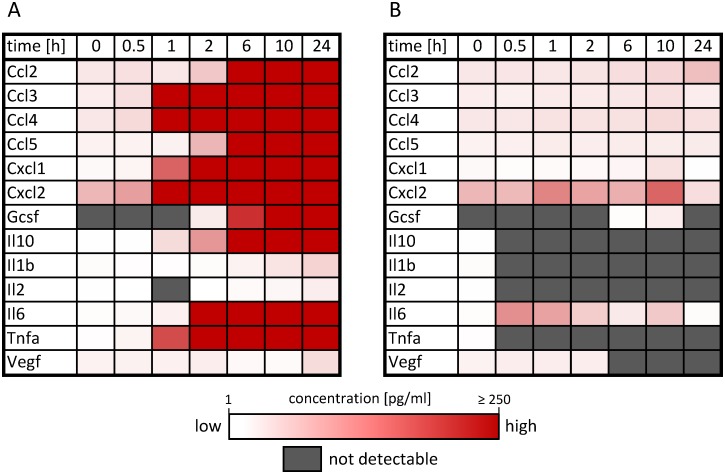
Fig 10. Protein secretion pattern of activated macrophages.
Supernatant from macrophages ((1 x 10⁶ cells) treated with (A) LPS or (B) IL-4/13 analyzed via Luminex Technology at the indicated time points. For specific concentrations as well as standard deviation, number of samples and p-values for secretion compared to untreated controls we refer to S2 Dataset.

