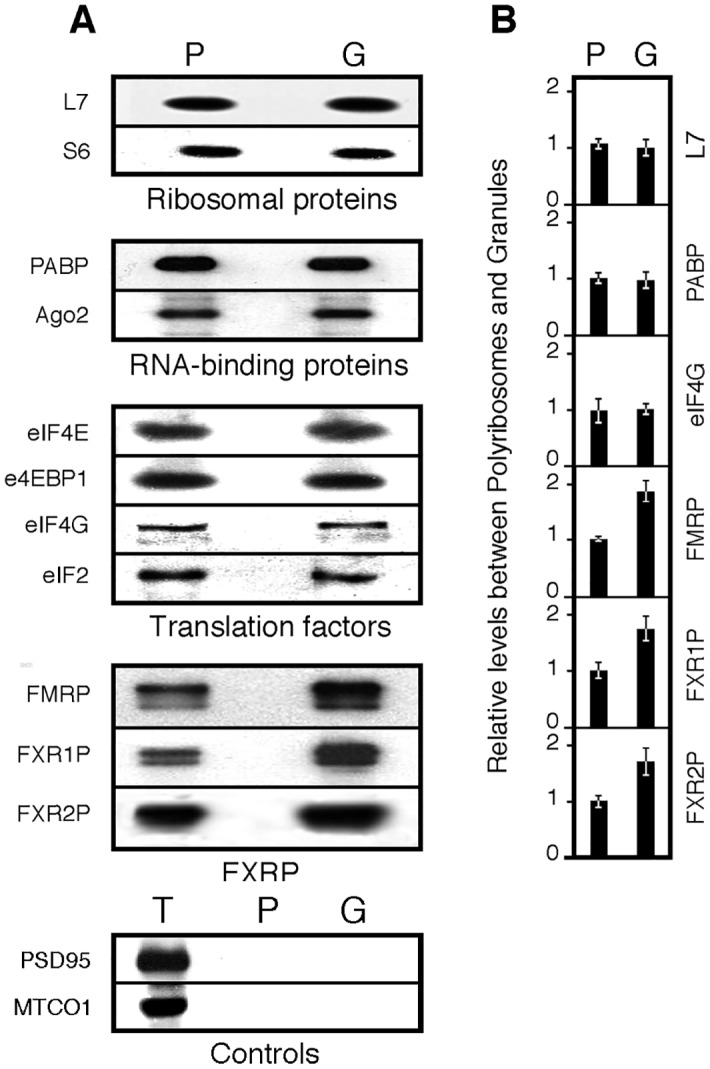
Fig 6. Comparative immunoblot analyses of selected proteins from polyribosomes and granules fractions.

A) Immunoblot analyses of the steady state levels of selected proteins in polyribosomes (P) and in granules (G) and in total extract (T). B) Quantification of the signals. Mean values ± SEM of ratios calculated from 4 independent analyses.
