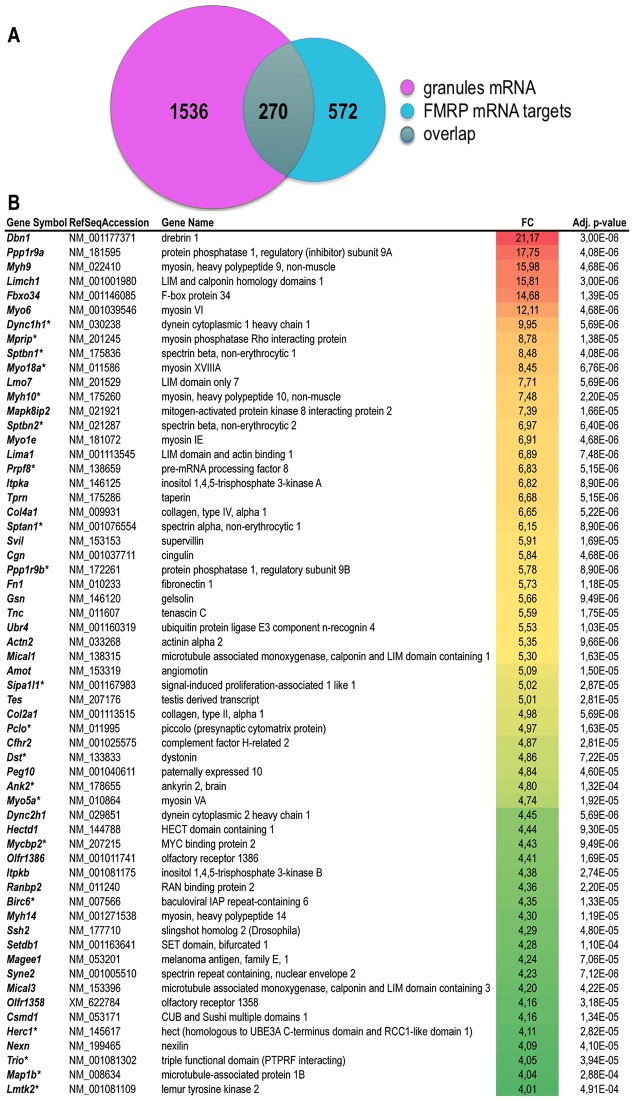
Fig 7. Overlap between mRNA present in granules and FMRP putative mRNA targets.
A) Venn diagram presenting intersection between the list of mRNA present in granules listed in S4 Table (n = 1806) to the list of 842 putative FMRP mRNA targets identified by Darnell et al. [33]. B) List of mRNA selectively enriched in granules as compared to polyribosomes. Enrichment is calculated as the ratio in average probe intensity (fold-of-change, FC) in granules as compared to polyribosomes preparation. Only transcripts corresponding to probes displaying an enrichment above 4 (FC>2) with a significant adjusted pvalue (pval<0.002) are presented. In case of redundant probes targeting a single mRNA, data are provided for the probe providing the highest level of variation. The color code indicates the highest (red) to the lowest (green) folds of change detected. The asterisk (*) indicates putative FMRP mRNA targets identified by Darnell et al. [33].

