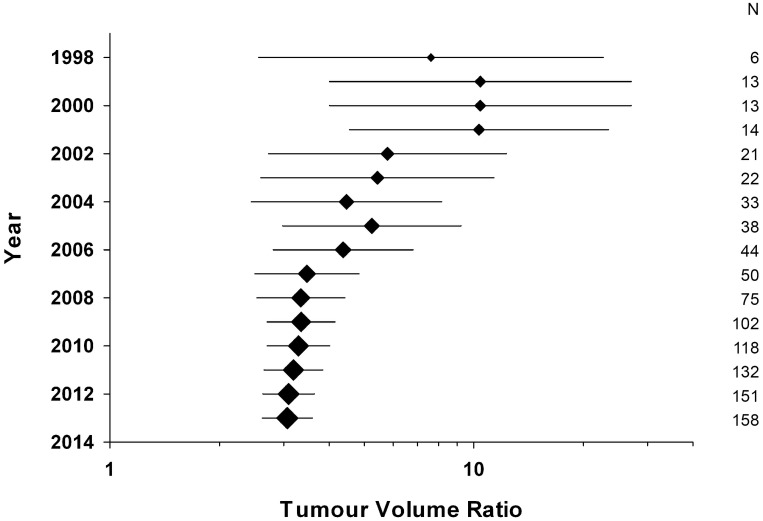
Fig 3. Cumulative meta-analysis.
Plotting cumulative global efficacy estimate with time shows a steady trend for values to become more conservative with time. Plot size is representative of the number of studies, values for which are included on the right hand side, and error bars represent the 95%CI of the mean.

