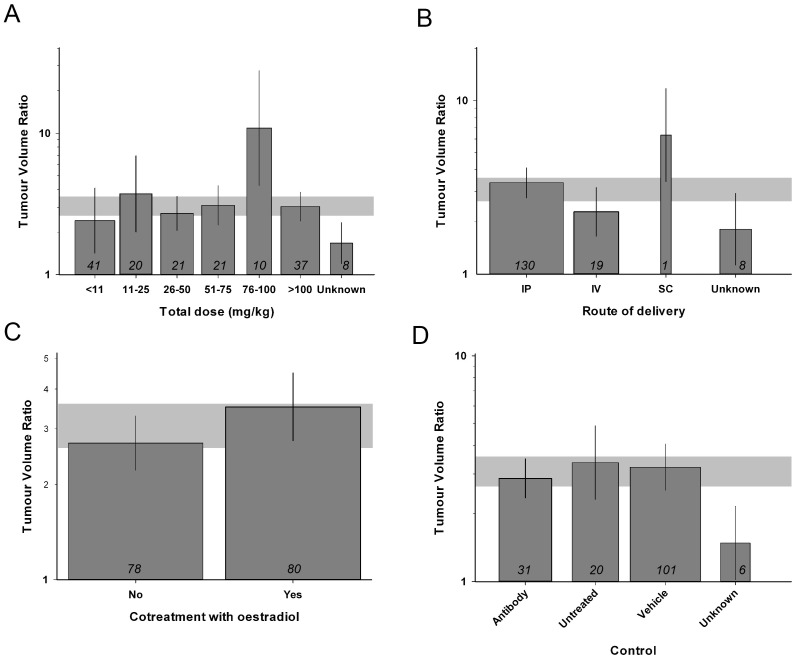
Fig 5. Stratification by trastuzumab treatment characteristics.
Total trastuzumab dose (A. χ2 = 723, df = 6, P<0.00385), route of drug delivery (B. χ2 = 62, df = 3, P<0.00385), cotreatment with oestradiol (C. χ2 = 336, df = 1, P<0.00385) and the choice of control (D. χ2 = 956, df = 3, P<0.00385), accounted for significant between-study variability in reduction of tumour volume. The grey band represents global 95% confidence intervals; columns represent mean ± 95% CI and column width a measure of number of comparisons within each stratum; the number of comparisons is included at the base of each column.

