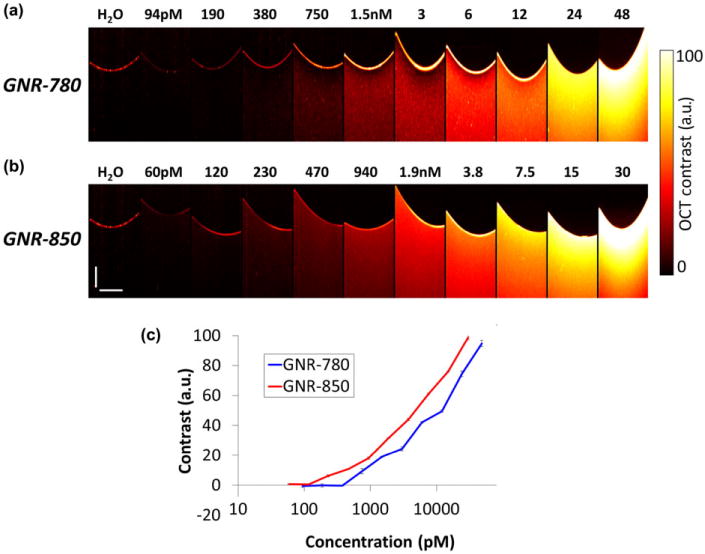
Figure 1.

Gold nanorod (GNR) optical coherence tomography (OCT) phantom studies. (a) OCT images recorded of wells containing GNRs dissolved in D.I. water corresponding to peak extinction wavelength of 780 nm at increasing concentrations from 0 to 48 nM. (b) OCT images recorded of wells containing GNRs dissolved in D.I. water corresponding to peak extinction wavelength of 850 nm at increasing concentrations from 0 to 30 nM. (c) Graph depicting OCT contrast generated by GNRs versus concentration of GNRs present in each corresponding well. GNRs with an extinction peak at 850 nm display higher OCT contrast as compared with 780 nm GNRs for each of the concentrations tested.
