Figure 5.

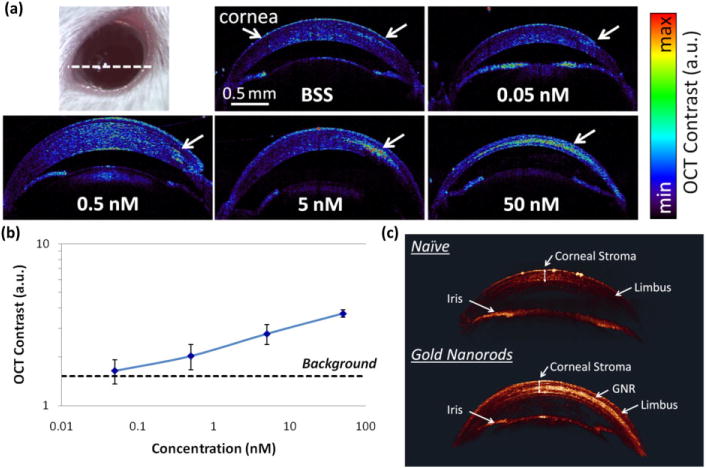
Quantifying GNR detection limit in mouse cornea. (a) Mice corneas were injected with 5 μL of GNR nanoparticles at decreasing concentrations from 50 nM to 0.05 nM (N = 4 total mice), and control mice corneas were injected with balanced saline solution (BSS). Although mice injected with 0.05 nM exhibited OCT contrast similar to control mice, concentrations of 0.5 nM and above produced a distinct detectable OCT signal. The OCT images represent a cross-sectional slide through the cornea (white dashed line). (b) Quantification of the OCT contrast (measured as signal from area of injection divided by corneal signal from an area distant from the injection) was observed to increase with the GNR concentration, with the lowest detectable concentration being 0.5 nM. Below this concentration, the OCT contrast was about equal to the OCT contrast recorded from the control mouse that was injected with BSS (denoted as Background in black dashed line). The error bars represent standard deviation of the OCT signal. (c) 3D rendering of OCT image. Although naïve mice show minimal signal in the corneal stroma (upper eye), mice injected with 10 μL of GNR at 50 nM show a bright and distinct OCT signal from the corneal stroma (lower eye). The corneal structures (corneal stroma, limbus and iris) exhibit very consistent OCT signal intensities across both the naïve and injected eyes. For 3D rotating videos, see Supporting Information videos.
