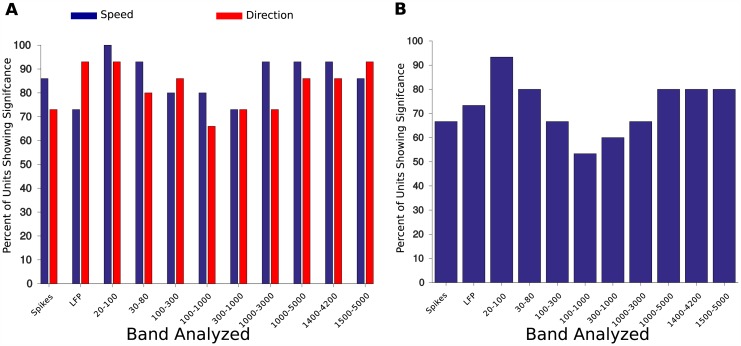
Fig 4. Percentage of recording sites with a significant tuning to speed, direction, or both as determined by an ANOVA analysis of signal power in different frequency bands.
Average power in each band was computed from the output from a bank of bandpass filters and significance levels were set at p < 0.05. (A) Percentage of recording sites with a significant tuning to speed or direction. Several bands driven by multi-unit activity (1,000–3,000 Hz, 1,000–5,000 Hz) are sensitive to both speed and direction. (B) Percentage of recording sites with significant tuning to both speed and direction. In several bands driven by multi-unit activity (1,000–3,000 Hz, 1,000–5,000 Hz) more than 80% of recording sites are sensitive to both speed and direction. In contrast, 66% of single unit spike rates were sensitive to both conditions.

