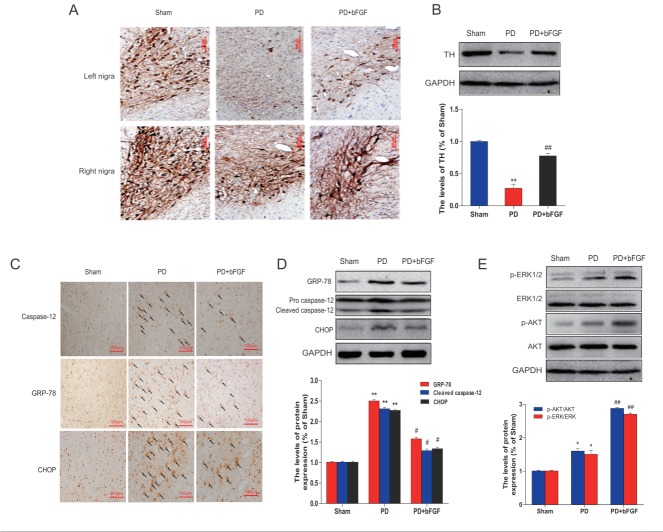
Figure 2.
Effects of bFGF on TH levels and ER stress-related proteins at 3 weeks post-lesion in PD rats. (A) Immunohistochemistry of TH-positive cells in the right and left nigra. (B) TH levels analyzed by Western blot. **P < 0.01 versus sham group, ##P < 0.01 versus PD group. (C) Immunohistochemical analysis of GRP78, CHOP and caspase-12 in the left nigra. (D) GRP78, CHOP and caspase-12 levels analyzed by Western blot. (E) Erk1/2 and Akt analyzed by Western blot. **P < 0.01 versus sham group, #P < 0.05 and ##P < 0.01 versus PD group (n = 6).

