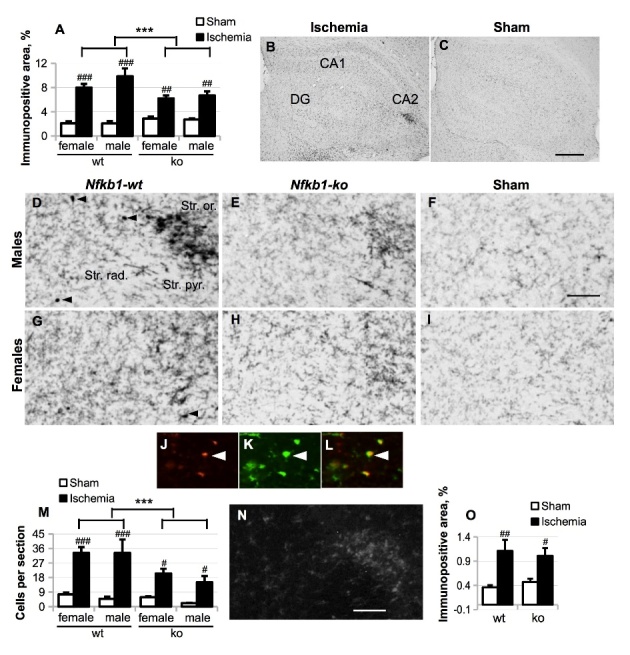
Figure 6.

Microgliosis was evaluated by anti-CD45 immunostaining five weeks after the BCCAo. (A), total CD45 immunoreactivity was evaluated in the whole hippocampal area (as delineated in Figure 5 A) and expressed as the percentage of the area of interest. Panel (B-I), representative images of CD45 immunostaining in the whole hippocampal area (B, C) or only CA2 area in the Nfkb1-wt ischemic mice (B, D, G), Nfkb1-ko ischemic mice (E, H) and Nfkb1-wt sham-operated mice (C, F, I). Scale bar in (B-C) equals 500 μm; scale bar in (D-I) equals 100 μm; DG, dentate gyrus. (J-L), CD45 immunoreactivity in CD45high-expressing cells (J; red) co-localized with Iba1-immunoreactivity (K, L; green). (M), the average number of CD45high small round cells (shown in (K-L)) per section. (N-O), a representative picture of Iba1 staining in the CA2 area of the ischemic hippocampus, scale bar equals 100 μm (N) and quantification of Iba1 immunoreactivity in the whole hippocampal area in male mice (O). P values are derived from three-way ANOVA followed by pairwise comparisons with Bonferroni’s adjustment. *** p < 0.001 in comparison to the Nfkb1-wt animals; # p < 0.05, ## p < 0.01, ### p < 0.001 in comparison to the sham-treated controls.
