. 2016 Jun 15;5:e15460. doi: 10.7554/eLife.15460

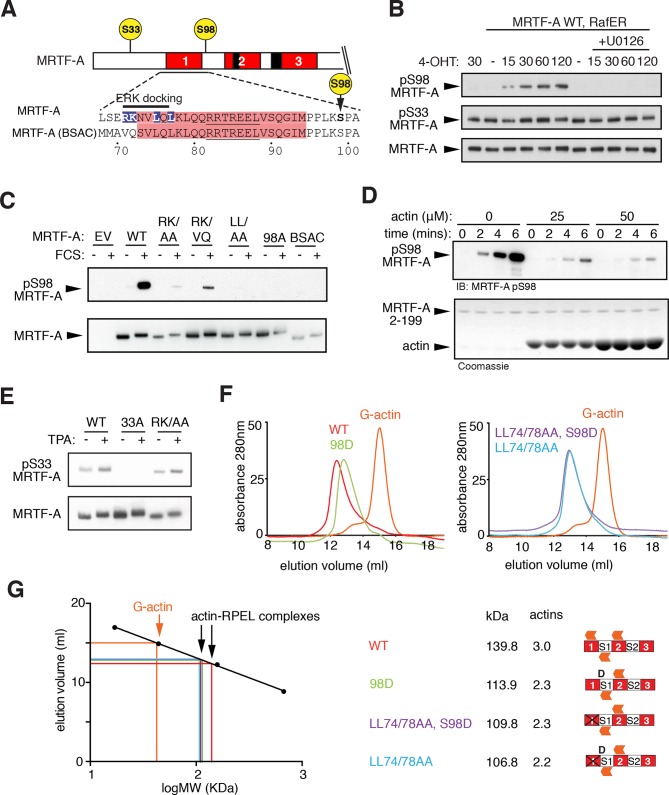
Figure 4. ERK-mediated phosphorylation of S98 inhibits actin binding.

(A) Sequences of MRTF-A(fl) and MRTF-A(BSAC), with RPEL1 highlighted in pink and the ERK-binding motif in blue. (B) Cells expressing Flag-MRTF-A and RafER were treated with 4OHT or vehicle and 10 μM U0126 as indicated. Lysates were analysed by immunoblot for MRTF-A pS98, MRTF-A pS33, and MRTF-A (Flag). (C) Cells expressing wild-type MRTF-A(fl) or derivatives with the indicated ERK-binding site mutations, or MRTF-A (BSAC), were analysed by immunoblotting with MRTF-A phospho-S98 antibody before and after serum stimulation. (D) Phosphorylation of recombinant MRTF-A(2-199) by ERK2 in the absence or presence of G-actin was monitored by MRTF-A phospho-S98 antibody (top) or coomassie staining (bottom). (E) S33 phosphorylation occurs independently of the ERK-binding motif. Cells expressing MRTF-A derivatives were analysed as in (C) using anti-MRTF-A phospho-S33. (F) Size exclusion chromatography of complexes formed between G-actin and recombinant MRTF-A(67–199) derivatives, or G-actin alone, colour coded. (G) Left, calibration curve; right, apparent stoichiometry of G-actin binding.

DOI: http://dx.doi.org/10.7554/eLife.15460.010

Figure 4.

Figure 4—figure supplement 1. ERK phosphorylation of MRTF-A S98.

Figure 4—figure supplement 1.

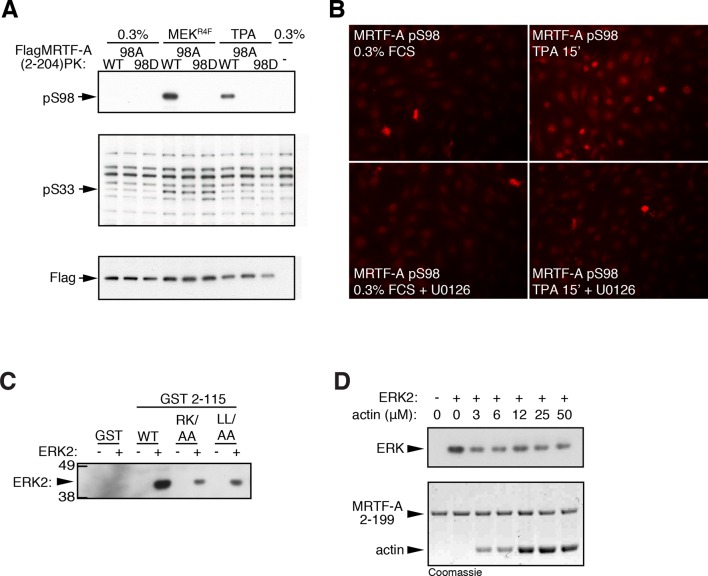
(A) Cells expressing Flag-MRTF-A(2–204)-PK and S98 mutants, with or without MEKR4F, were maintained in 0.3% FCS for 20 hr, then stimulated with 100 ng/ml TPA and phosphorylation of S98 and S33 analysed by immunoblotting. (B) Immunofluorescence assay of NIH3T3 cells before and after a 15' TPA stimulation with U0126 addition as indicated. (C) ERK interacts with the MRTF-A N-terminal sequences via the ERK docking motif. GST MRTF-A (2–115) or docking site mutant derivatives were used in pulldown assays with recombinant ERK2. (D) G-actin does not detectably compete for ERK binding in the pulldown assay. Assays with GST-MRTF-A (2–199) were as in (C) except that increasing amounts of G-actin were included.
Figure 4—figure supplement 2. S98 phosphorylation impairs assembly of MRTF-A / G-actin complexes.

Figure 4—figure supplement 2.

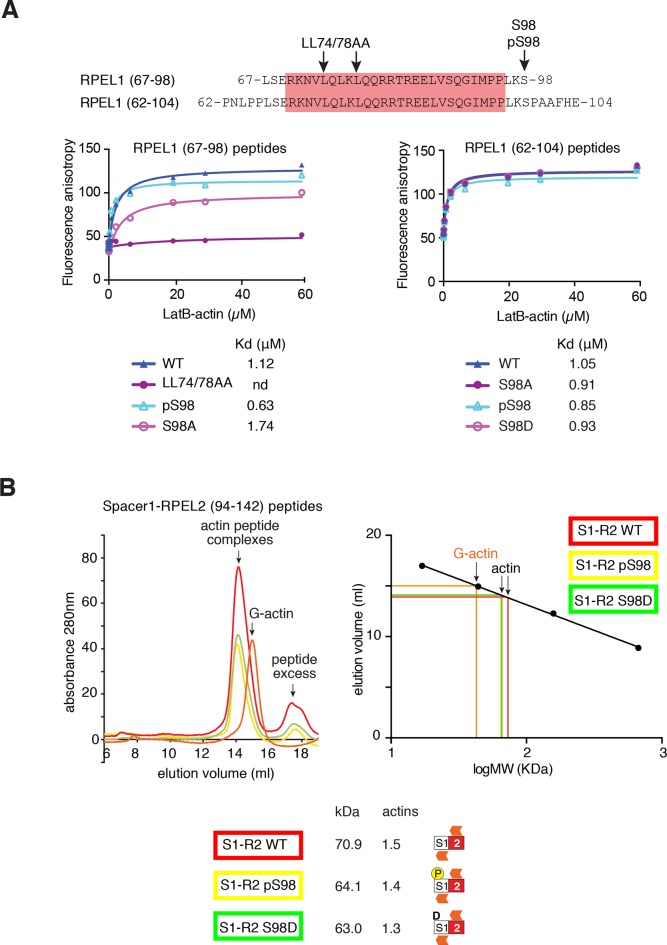
(A) Top, sequences of the RPEL1 containing peptides used in the fluorescence polarisation anisotropy assay, with mutation and phosphorylation sites indicated. Bottom, fluorescence anisotropy assay of G-actin binding to FAM-labeled RPEL1 peptides. Data represent mean of at least two independent experiments. (B) Size exclusion chromatography profiles of G-actin / Spacer1-RPEL2 peptide complexes or G-actin alone are shown, colour coded, with calibration at the right, and data are summarised below.