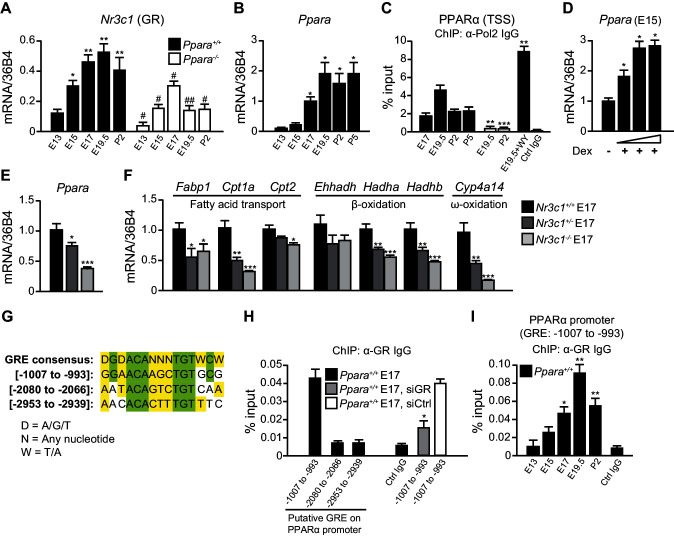
Figure 1. GR directly controls fetal PPARα expression.
(A, B) Ontogenic expression of Nr3c1 (A) and Ppara (B) mRNA in the developing mouse liver. *p<0.05, **p<0.01 vs. E13 samples; #p<0.05, ##p<0.01 vs. WT counterparts. (C) Enrichment of the DNA fragments containing the PPARα TSS using anti-Pol2 antibodies or pre-immune control IgG with or without PPARα agonist (WY-14643) treatment in pregnant dams. **p<0.01, ***p<0.001 vs. respective WT counterparts without WY-14643 treatment. (D) Ppara mRNA levels in the E15 Ppara+/+ liver explants with or without dexamethasone (Dex) treatment for 24 hr. Dex concentrations of 0.1 μM, 1 μM, and 10 μM were used. The vehicle control group was treated with 0.1% ethanol. *p<0.05 vs. vehicle control. (E,F) mRNA expression of PPARα and its target genes in the fetal livers of GR models at E17. *p<0.05, ** p<0.01, ***p<0.001 vs. Nr3c1+/+ liver. (G) Alignment of the GRE consensus sequence with the three putative GRE sequences located upstream of the PPARα promoter. (H) Enrichment of the DNA fragment containing the three putative GRE found within the PPARα promoter at regions spanning −1007 to −993, −2080 to −2066, and −2953 to −2939 in fetal liver at E17 using anti-GR antibody or pre-immune control IgG. Enrichment levels were expressed as the percentage input. GR-targeting siRNA was used to knockdown Nr3c1 expression and to determine the specificity of GR binding to this putative GRE. *p<0.05 vs. non-targeting siRNA treatment group. (I) Enrichment of GRE spanning -1007 to −993 of the PPARα promoter in Ppara+/+ liver during development. *p<0.05, **p<0.01 vs. E13 samples. Data are presented as mean ± SEM; n = 4–6. Statistical analyses were performed using two-tailed Mann-Whitney tests.

