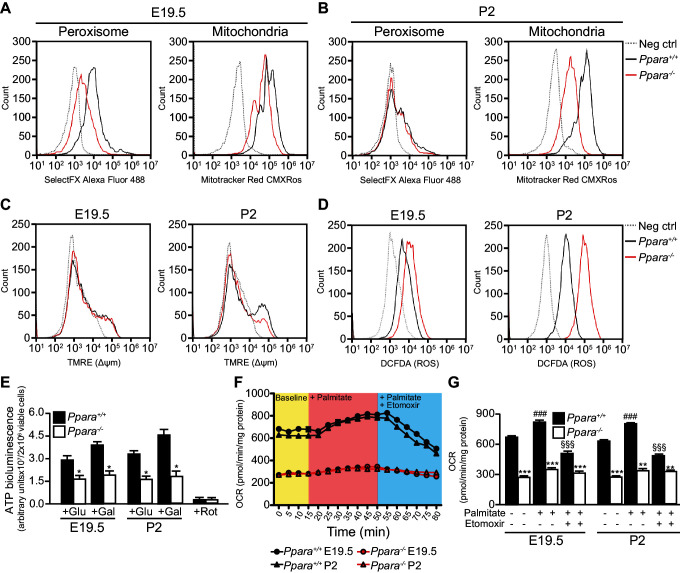
Figure 3. Defective mitochondrial function, fatty acid oxidation and energy production in Ppara-/- hepatocytes.
(A,B) Flow cytometric analyses of intracellular peroxisomes and mitochondria in primary hepatocytes isolated from Ppara-/- and Ppara+/+ livers at E19.5 (A) and P2 (B) using Alexa Fluor 488-labeled antibodies against peroxisome membrane protein 70 and Mitotracker Red, respectively. (C,D) Flow cytometric analyses of mitochondrial membrane potential (∆ΨM) (C) and intracellular ROS (D) in primary hepatocytes isolated from Ppara-/- and Ppara+/+ livers at E19.5 and P2 using tetramethylrhodamine, ethyl ester (TMRE) and 2’,7’-dichlorofluorescin diacetate (DCFDA), respectively. (E) ATP production in primary hepatocytes isolated from Ppara-/- and Ppara+/+ livers (n = 4 per group) in the presence of glucose (+Glu), galactose (+Gal), or rotenone (+Rot, a mitochondrial electron transport chain complex I inhibitor) as a negative control. Values represent arbitrary bioluminescence units normalized to the number of viable cells. (F,G) Oxygen consumption rates (OCRs) in primary hepatocytes isolated from Ppara-/- and Ppara+/+ livers in the presence or absence of palmitate and etomoxir, a mitochondrial β-oxidation inhibitor. Data are presented in time-lapse (F) and treatment end points (G) at 15 min for basal respiration, 50 min for palmitate treatment, and 80 min for palmitate cum etomoxir treatment. Data represent mean ± SEM; n = 3–9 unless otherwise stated, **p<0.01, ***p<0.001 vs. wild-type controls; ###p<0.001 vs. no treatment group; §§§p<0.001 vs. palmitate treatment group (two-tailed Mann-Whitney test).

