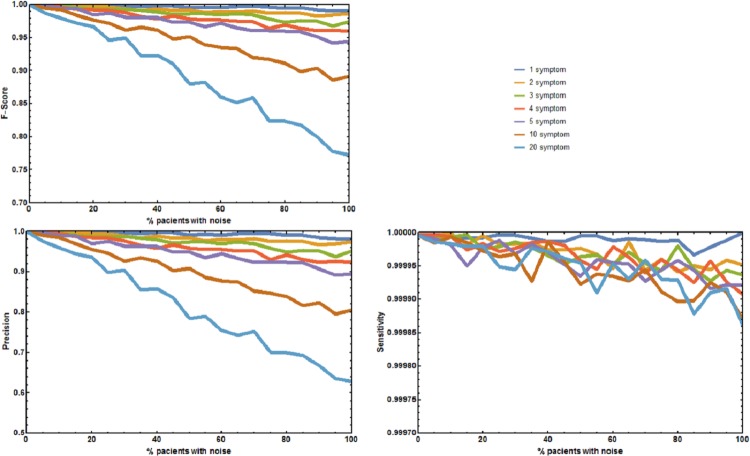
Figure 2. Joint effect of unreported and unrelated symptoms on the predictive accuracy of Rare Disease Discovery.
(A) Plot of F1-Score as a function of the % of patients with a known rare disease where 1, 2, 3, 4, 5, 10, or 20 symptoms were randomly added or deleted. (B) Plot of Precision as a function of the % of patients with a known rare disease where 1, 2, 3, 4, 5, 10, or 20 symptoms were randomly added or deleted. (C) Plot of Sensitivity as a function of the % of patients with a known rare disease where 1, 2, 3, 4, 5, 10, or 20 symptoms were randomly added or deleted. Without noise, the F1-Score is always 1. The F1-Score decreases as noise (% of patients with deleted symptoms) increases. This is mainly due to a decrease in precision. Sensitivity is always low because the number of false positives is always orders or magnitude smaller than the number of true negatives. In the worst case scenario (20 incorrect symptoms in 100% of the patients), the appropriate disease is contained in the set of diseases with the highest score for more than 80% of the patients.

