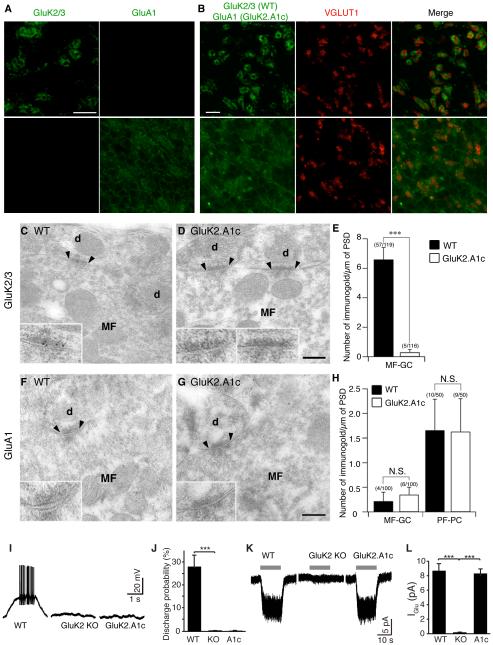
Figure 3. The GluK2 cytoplasmic domain is required for synaptic KAR localization in cerebellar granule cells.
(A-H) Distribution of KARs in cerebellum of GluK2.A1c KI mice. (A) Immunohistochemical staining of the granular cell layer of mouse cerebellum. GluK2/3 signal was observed only wild-type (WT) mice, whereas GluA1 signal was observed only in GluK2.A1cyto KI mice. Because of no endogenous GluA1 in the granule cells, the GluA1 signal indicates specific expression of GluK2.A1cyto protein. (B) GluK2 was enriched at cerebellar glomeruli around the mossy fiber presynaptic marker VGLUT1, whereas GluK2.A1cyto was distributed diffusely. Scale bars: 10 µm. (C-H) Immuno-electron microscopic images of GluK2 and GluK2.A1cyto proteins. Inserts show high-magnification of labeled synapses. Scale bars: 200 nm. (C–E) GluK2 was detected at MF-GC synapses in WT mice, but not in GluK2.A1c KI mice. (F–H) No GluK2.A1cyto signal was detected at MF-GC synapses from both WT and GluK2.A1c KI mice with anti-GluA1 C-terminal antibody. By contrast, endogenous GluA1 was detected at similar levels in cerebellar parallel fiber (PF)-Purkinje cell (PC) synapses in both WT and GluK2.A1c KI mice. Numbers of immunogold-labeled synapses and total analyzed synapses are indicated in parentheses. (I-L) KAR activity was measured in cerebellar granule cells. To isolate KAR activity from other glutamate receptors, recordings were performed on the stargazer genetic background. (I, J) Mossy fiber-evoked responses were recorded under the whole-cell current-clamp configuration. KAR-dependent synaptic transmission at cerebellar mossy fiber–granule cell synapses was abolished in both GluK2 KO and GluK2A1c KI mice (WT n =5, KO and K2.A1c n = 4 each). (K, L) KAR activity at the cell surface was measured using 300 µM glutamate (gray bar) in the presence of 100 µM picrotoxin and 100 µM D-AP5. Surface KAR activity was detected at similar levels in WT and GluK2.A1cyto KI mice, but not in GluK2 KO (GluK2−/−) mice (WT n =5, KO and A1c n = 4 each). Data are given as mean ± s.e.m. ***, P < 0.001 (Student’s t-test).

