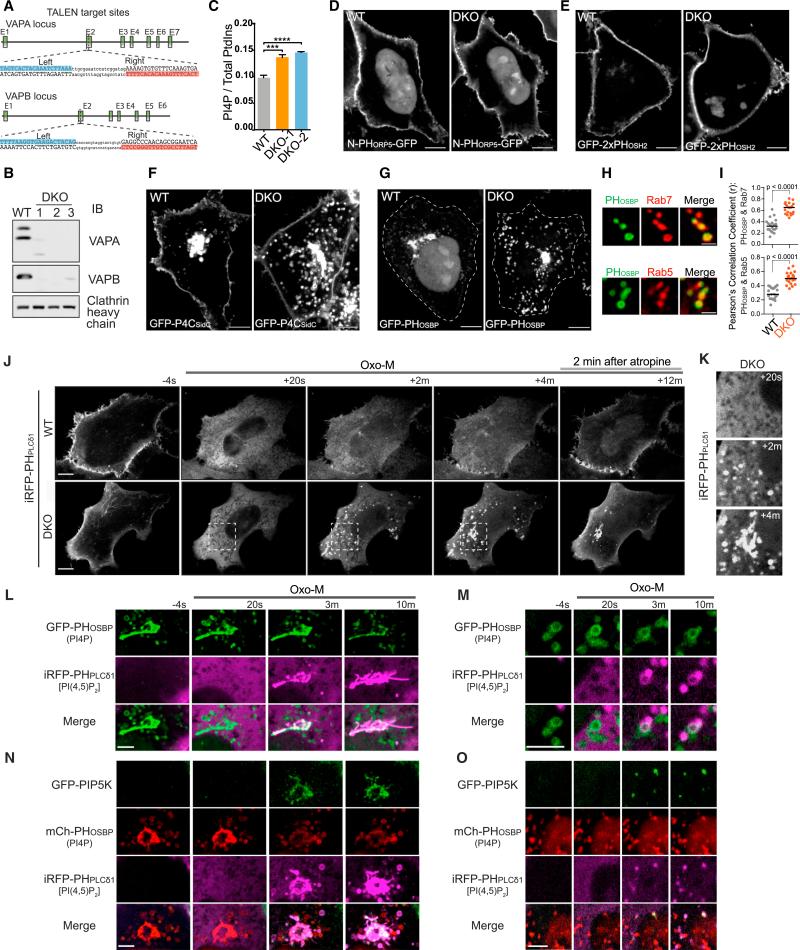
Figure 1. Increased Abundance of PI4P on Endosomes in VAP DKO Cells.
(A) Schematic depiction of TALEN targeting sites in exon 2 of human VAPA and VAPB loci. The sequences targeted by the TALEN pairs are highlighted in blue (left arm) and red (right arm) respectively.
(B) Western blot of WT HeLa cells and of three independent VAP DKO HeLa cell lines.
(C) HPLC analysis of cell extracts showing an increased ratio of PI4P versus total inositol phospholipids in VAP DKO cells relative to WT cells. n = 3 independent experiments. Data are represented as mean ± SEM. WT versus DKO-1, ***p = 0.007; WT versus DKO-2, ****p < 0.0001.
(D–G) Confocal images of WT and VAP DKO cells expressing four different PI4P probes: N-PHORP5-GFP (D) and GFP-2xPHOSH2 (E), which label selectively PI4P at the plasma membrane, GFP-P4CSidC (F), which labels PI4P both at the plasma membrane and on internal membranes, and GFP-PHOSBP (G), which labels intracellular PI4P pools. Note the increase of PI4P on vesicular compartments, but no obvious PI4P accumulation at the plasma membrane in VAP DKO cells. Scale bar, 10 μm.
(H and I) Confocal images of VAP DKO cells co-expressing the PI4P probe GFP-PHOSBP and the endosome markers mCh-Rab7 and Rab5-mRFP, revealing the presence of PI4P on endosomes (H). Scale bar, 2 μm. Graph of Pearson's correlation coefficient shows greater colocalization of GFP-PHOSBP with mCh-Rab7 and Rab5-mRFP in VAP DKO cells (I) (n = 20 cells, two-tailed t test).
(J and K) Time-lapse confocal images of WT and VAP DKO cells co-transfected the PI(4,5)P2 probe iRFP-PHPLCd1 and the muscarinic receptor M1R. Oxo-M (20 μM) was added to cells at time 0 and the M1R antagonist atropine (50 μM) after 10 min. DKO cells show ectopic accumulation of PI(4,5)P2 on intracellular vesicles. The region of the DKO cell indicated by a dashed box in (J) is shown at high magnification in (K). Scale bar, 10 μm. See also Movie S1.
(L–O) High-magnification time-lapse images of VAP DKO cells co-transfected with M1R and the indicated plasmids, showing the appearance of PI(4,5)P2 in the PI4P-rich Golgi complex (L) and on a subset of PI4P-positive vesicles (M) in response to Oxo-M stimulation. PIP5K1γ87 also accumulates in the Golgi complex (N) and on a subset of intracellular vesicles (O) as they become PI(4,5)P2 positive. Scale bar, 5 μm.
See also Figure S1.

