
Figure 5.
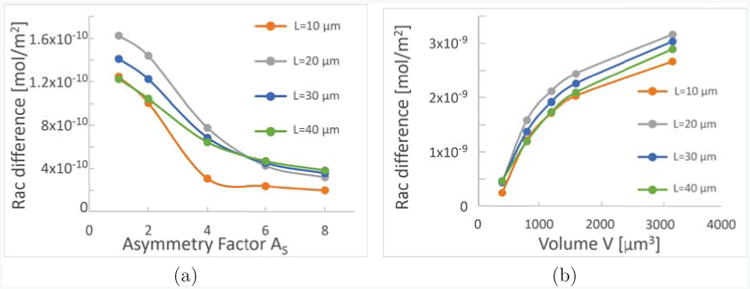
Geometry influences Polarization strength. As a measure of polarization strength, we show the difference of active Rac on the membrane at the front and at the back of the cell, for cells of different rectangular shapes. Each plot shows four graphs for cells of different lengths, L = 10μm (orange), 20μm (gray), 30μm (blue), 40μm (green). In (a) the volume is fixed to be V = 800μm3, and the sides w ≥ d perpendicular to L of the rectangle are fixed in dependence on the asymmetry factor AS as , . In (b), the volume dependence is shown while .