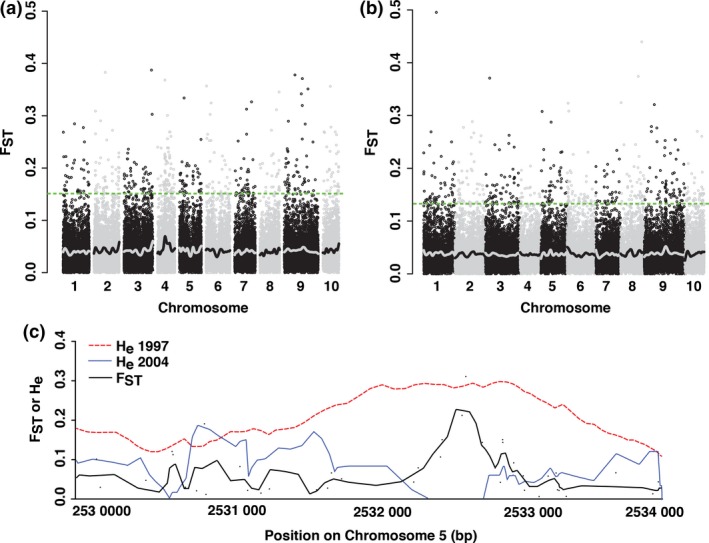
Figure 1.

Genetic differentiation (F ST) throughout the genome between predrought ancestors (1997) and postdrought descendants (2004) of Brassica rapa in the (a) Arboretum and (b) Back Bay populations, and (c) within one flowering time gene in the Arb population. For (a) and (b), each point is a gene, and average F ST was calculated for each gene using 100‐kb sliding windows. The green dashed line indicates the significance cut‐off (q‐value < 0.05), of F ST > 0.15 for Arb and F ST > 0.13 for BB. The number of significantly differentiated genes was 434 for Arb and 433 for BB. This shows evidence for rapid evolutionary shifts in these genes. A LOESS trend line is shown in black and grey. In (c), differentiation (F ST) between ancestors and descendants and expected heterozygosity (H e) from 1997 (red dashed line) and 2004 (blue dotted line) Arb populations are shown for 4 kb of Bra004928, the SOC1 paralog on chromosome 5. This region shows high F ST and a decrease in H e from 1997 to 2004, providing potential evidence of recent selection.
