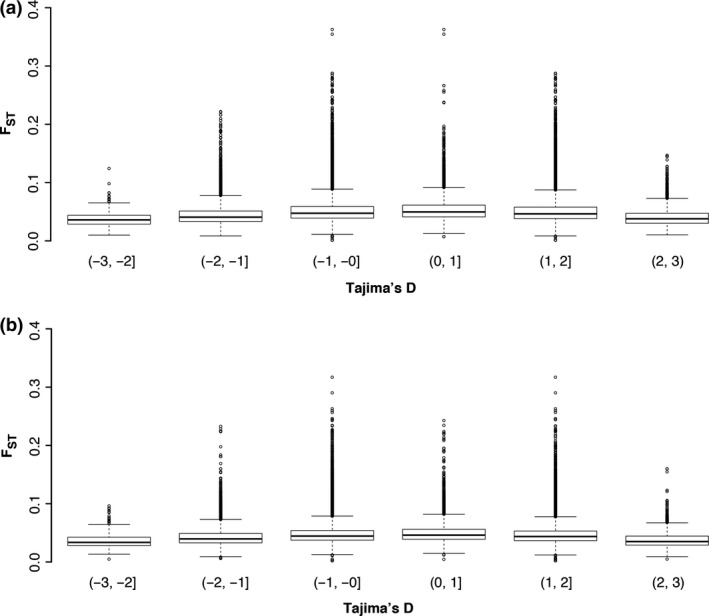
Figure 2.

Boxplots of F ST at different ranges of Tajima's D for (a) Arb and (b) BB descendants (2004). There is no apparent correlation between Tajima's D and F ST, indicating that regions that were differentiated between 1997 and 2004 (high F ST) are not the same as regions that were under longer‐term selection (low Tajima's D). Instead, genes with extreme Tajima's D values tended to have low F ST values.
