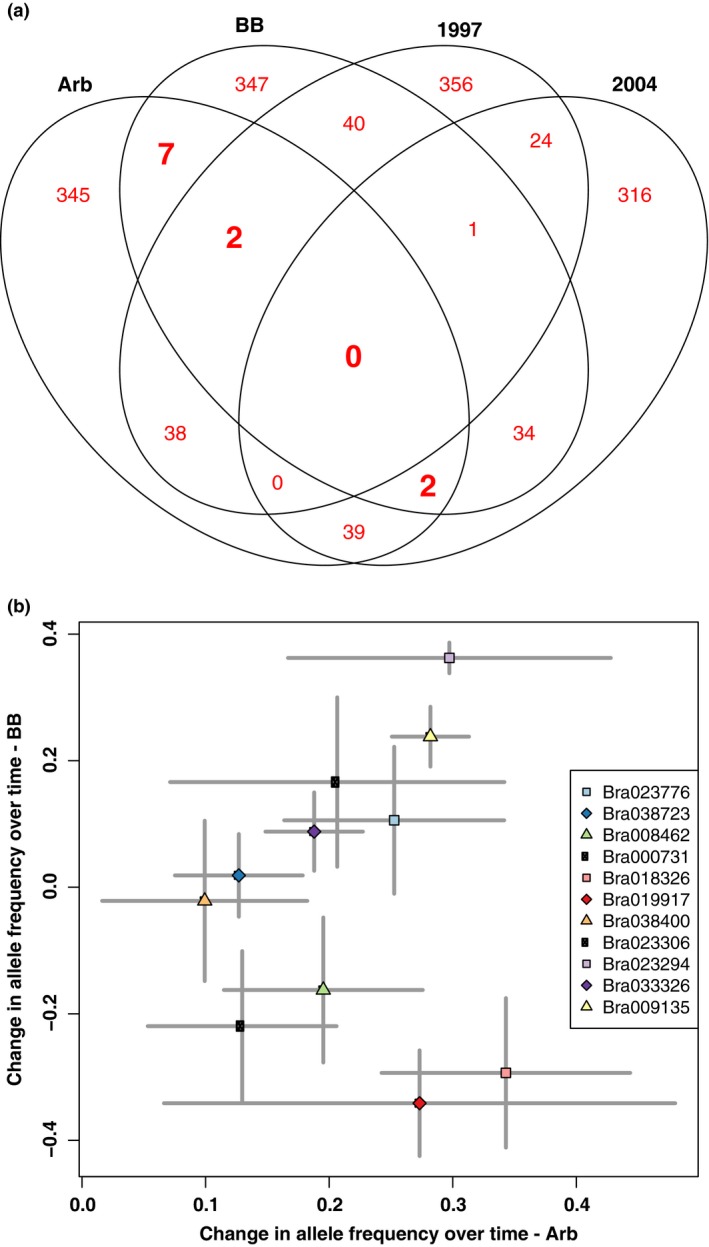
Figure 3.

Few genes evolved in parallel in the Arb and BB populations. (a) Venn diagram of the outlier genes significantly differentiated (q‐value < 0.05) between all temporal and geographic populations. For example, the numbers in the ellipse labelled Arb are the number of outlier genes that were outliers between ancestors and descendants in the Arb population. The genes that overlap between the Arb and BB ellipses (11 genes, shown in bold) are the genes that were outliers in both the Arb and BB populations. (b) Comparison of changes in ancestor‐descendant allele frequencies in Arb and BB populations for the 11 genes with significant differentiation in both populations. Points are coloured by gene (see legend). The major allele for Arb in 2004 is always tracked for each locus. The central point is the mean, and bars represent standard errors. The lack of correlated change between the two populations indicates little evidence for parallel evolution.
