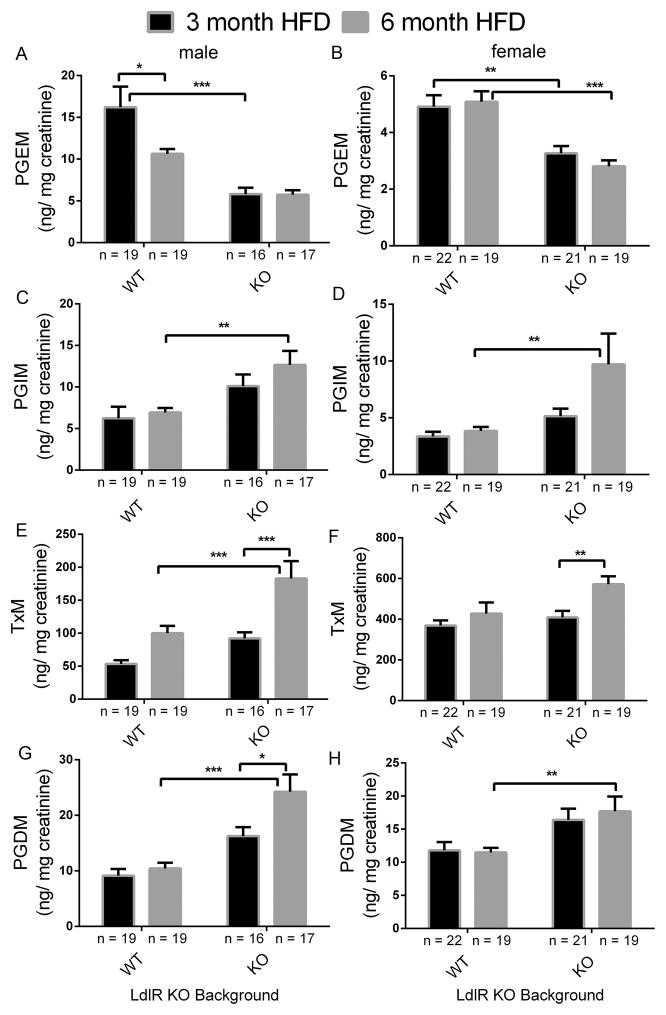
Figure 3. Impact of prostacyclin receptor (Ip) and microsomal prostaglandin E synthase 1 (mPges-1) deletion on prostaglandin biosynthesis in mice on a high-fat diet (HFD).
Fasting (9am-5 pm) urine samples from LdlR KO (WT) and Ip/mPges-1/ LdlR TKO (KO) mice were collected at the end of a HFD feeding, and prostanoids metabolites were analyzed by liquid chromatography/ mass spectrometry, as described in the Methods. Deletion of Ip and mPges-1 suppressed PGE2 but increased PGI2 biosynthesis as reflected in their urinary PGEM (7-hydroxy-5, 11-diketotetranorprostane-1, 16-dioic acid) (A and B) and PGIM (2, 3-dinor 6-keto PGF1α) (C and D) metabolites, respectively. Urinary 2, 3-dinor TxB2 (TxM) was also elevated in LdlR KO and TKO mutants after feeding a HFD in both sexes (E and F). PGDM (11, 15-dioxo-9α-hydroxy-2,3,4,5-tetranorprostan-1,20-dioic acid) levels in mice were augmented in the TKO mutants (G and H). PGDM levels in female were not changed between WT and KOs. Two-way ANOVA showed a significant effect of genotype and/ or treatment on urinary prostanoid levels in both genders fed a HFD (PGEM, male- genotype, p< 0.0001, treatment, p= 0.0538, interaction, p= 0.0591; PGEM, female- genotype, p< 0.0001, treatment, p= 0.6640, interaction, p= 0.3409; PGIM, male- genotype, p= 0.0005, treatment, p= 0.2168, interaction, p= 0.4786; PGIM, female- genotype, p= 0.0057, treatment, p= 0.0643, interaction, p= 0.1341; TxM, male- genotype, p= 0.0001, treatment, p< 0.0001, interaction, p= 0.1423; TxM, female- genotype, p= 0.0220, treatment, p= 0.0062, interaction, p= 0.1866; PGDM, male- genotype, p< 0.0001, treatment, p= 0.0153, interaction, p= 0.0781; PGDM, female- genotype, p= 0.0006, treatment, p= 0.7456, interaction, p= 0.6011). Multiple comparison tests (Holm-Sidak) were used to test significant differences between LdlR KO and Ip/mPges-1/ LdlR TKOs. Data are expressed as means ± SEMs. *p< 0.05, **p< 0.01, ***p<0.001; n=16–19 (male) and 19–22 (female) per genotype.

