
Figure 3. Cells expressing unphosphorylated Olig2/pOLIG2low are invasive.
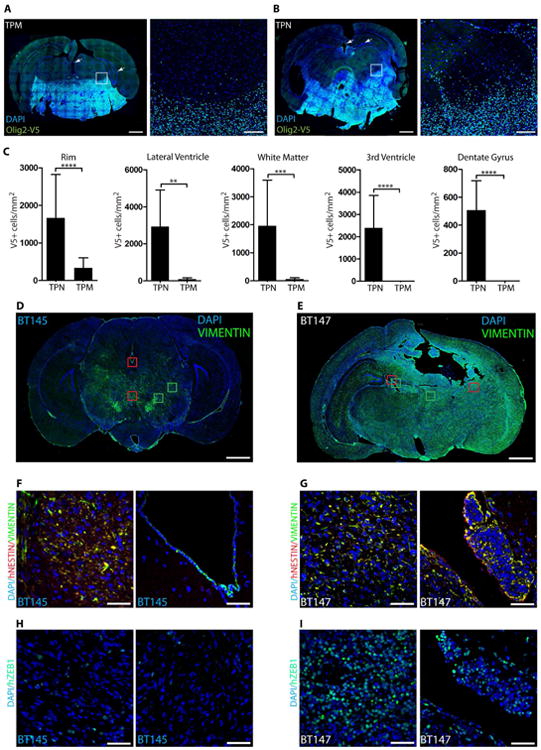
(A-B): mGSCs expressing TPN mutant form highly infiltrative tumors compared to TPM-expressing mGSCs. Immunostaining for V5 epitope tag (green) in murine TPM-expressing tumors (DAPI - blue) (A). TPN-expressing tumors show infiltration of normal brain parenchyma, the ventricular and hippocampal area (arrows) (B). Scale bars = 1mm and 100 μm. Quantification of invading tumor cells at the peritumoral rim (the area comprised in white boxes in A and B), ventricular areas, white matter tracts, and dentate gyrus regions (C) (arrows). Tumors induced by hGSCs with pOLIG2high (BT145) are less invasive compared to pOLIG2low (BT147) (D-I). Immunostaining with anti-VIMENTIN (green) in human GBM xenograft tissues derived from BT145 (D) or BT147 (E) (DAPI - blue). Scale bars = 1mm. Tracking tumor cells with human-specific NESTIN in PDX tissues (F and G). Images of hNESTIN (red) and VIMENTIN (green) immunostaining in BT145 tumor tissue (zoom-in images of red boxed regions from D) (F). Images of hNESTIN immunostaining in BT147 tumor tissue (zoom-in of red boxed regions from E) (G) (DAPI - blue). Immunostaining with anti-hZEB1 in BT145 (H) and BT147 (I) tissues (zoom-in images of green boxed regions from D and E). For all bar graphs, data represent mean ± SD of three independent experiments.*p < 0.05; **p < 0.01; ***p < 0.001. See also Fig. S3.