
Figure 4. GBM cells expressing unphosphorylated OLIG2 (or pOLIG2 low) are infiltrative and are found at the tumor core and rim.
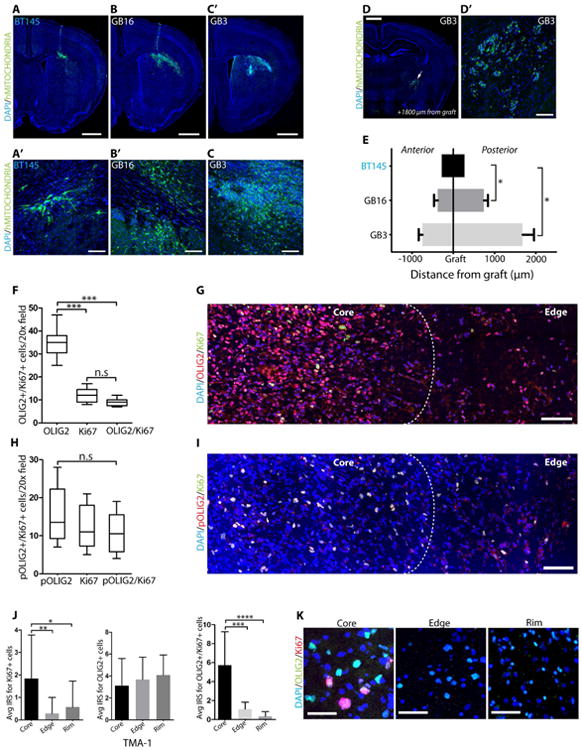
Analysis of tumor cell invasion in GBM xenograft models (GB3, GB16 and BT145) three weeks post-implantation (A-F). Immunostaining of tumor tissue with human-specific mitochondrial antibody (green) in GB3 (A and A′), GB16 (B and B′), and BT145 (C and C′). Scale bars = 1mm and 50μm. Immunodetection of GB3 tumor cells away from injection site within the white matter tracts (D and D′). Scale bars = 1mm and 100μm. Distance travelled by tumor cells from the graft site to the anterior or posterior regions (N=3 for each group) (E). OLIG2+ cells are found throughout the tumor tissue. Quantification (F) and immunodetection (G) of OLIG2+ (red) and Ki67+ (green) cells (both single and double labelled cells) in GBM patient tissue section. Proliferating cells in human GBM tissue express pOLIG2. Quantification (H) and immunostaining (I) with pOLIG2 (red) and Ki67 (green) antibodies (both single and double labelled cells) in GBM patient tissue sections. (DAPI - blue). G and I images are representative of 5 GBM cases. For F and H, total number of cells from 5 individual fields per patient tumor tissue section were counted. Scale bars = 100μm Analysis of glioma invasion TMA immunostained with OLIG2 and Ki67 antibodies. (J) Immune Reactivity Score (IRS) quantification of OLIG2+ and Ki67+ cells across 33 patient tumor core, edge, and rim in GBM patient TMA (both individual and coexpressing cells). (K) Representative images of OLIG2 (green) and Ki6 (red) staining from core, edge and rim in TMA sections. Scale bar = 50 μm. For all bar graphs, data represent mean ± SD from multiple experiments.*p < 0.05; **p < 0.01; ***p < 0.001. See also Fig. S4.