
Figure 6. SMAD2 phosphorylation is inversely correlated with high expression of pOLIG2.
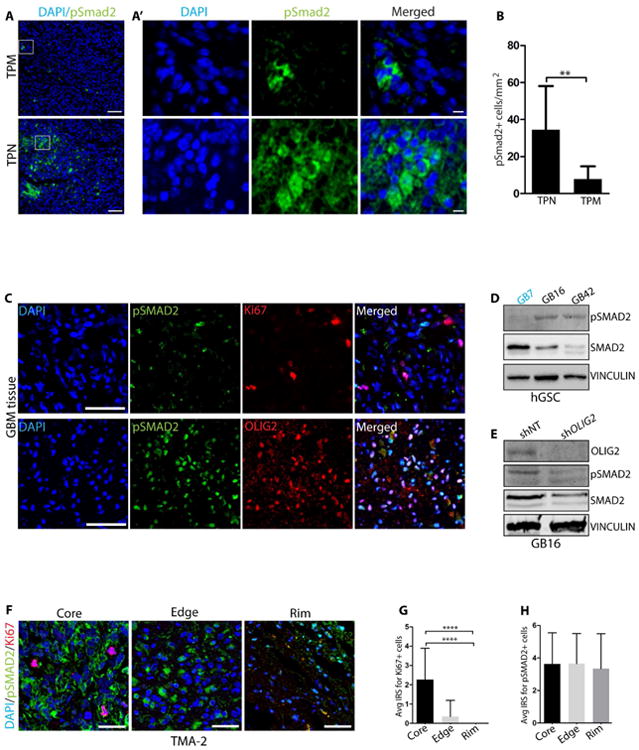
(A) Immunodetection of pSmad2 (green) in orthotopic tumors induced by mGSCs expressing TPM (upper panel) or TPN (lower panel) mutant. (A′) Right sub-panels show higher magnification images in the boxed area from A. (B) Quantification of pSmad2+ cells in TPN and TPM tumor tissues (cells from 5 independent fields from three tumor tissues each were counted). (C) Representative images from immunostaining of consecutive patient GBM tissue sections with pSMAD2 (green)/Ki67 (red) and pSMAD2 (green)/OLIG2 (red) antibodies. DAPI staining in blue. (D) Western blot analysis of indicated hGSC lysates for pSMAD2 expression. (E) Western blot analysis for OLIG2, pSMAD2, and SMAD2 after transduction with shNT or shOLIG2 lentivirus in GB16 cells. (F) Representative images of Ki67 and pSMAD2 immunostaining at core, edge and rim regions in TMA-2. IRS quantification of Ki67+ (red) (G) and pSMAD2+ (green) (H) cells at core, edge and rim regions (see methods for details). DAPI is in blue. Scale bars = 50 μm (A), 5 μm (A′) 100 μm (C) and 50 μm (F). For bar graphs B, G and H, data represent mean ± SEM. *p < 0.05; **p < 0.01; ***p < 0.001. See also Fig. S6.