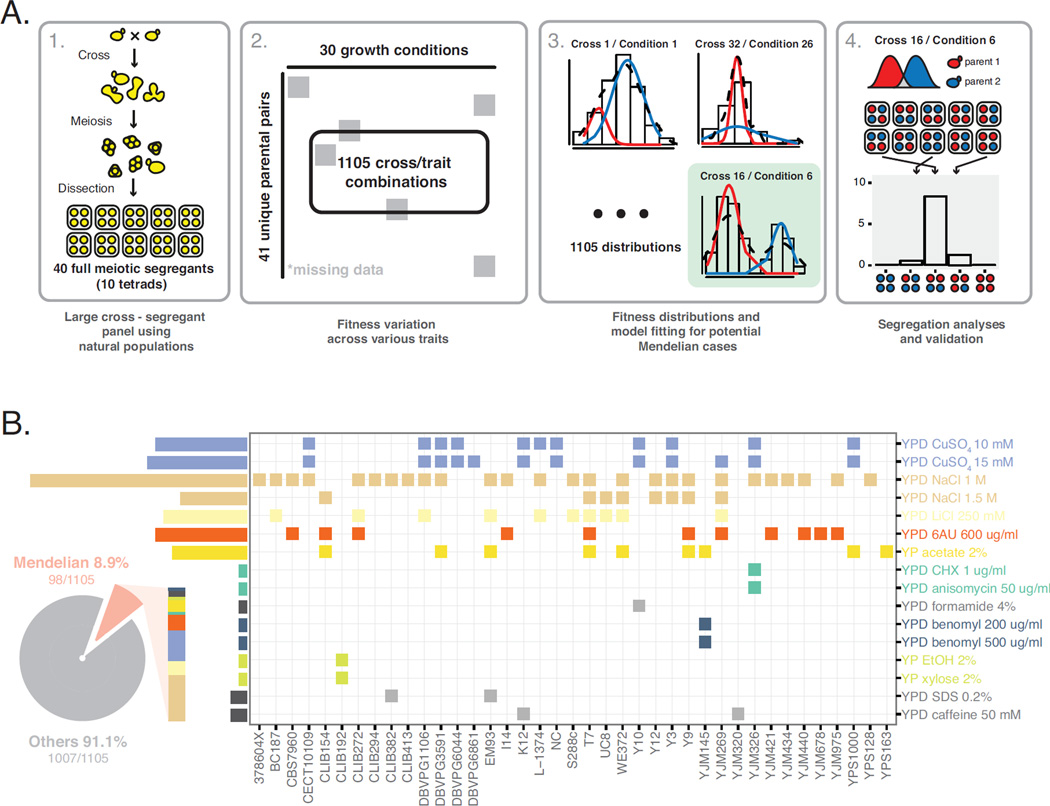
Fig 1. Comprehensive landscape of Mendelian traits in S. cerevisiae.
(A) Workflow of the detection of Mendelian traits. The workflow was defined as 4 steps, consisting with offspring generation, fitness measurements, model fitting and segregation analysis as indicated. (B) Distribution of all identified Mendelian traits spanning different crosses (x-axis) on conditions tested (y-axis). Each square represents any single Mendelian case and colors indicate different conditions. Pie chart represent the fraction of Mendelian cases relative to the entire dataset. See Figure S1 for method summary and Figure S2 for genomic mapping results for selected Mendelian cases.

