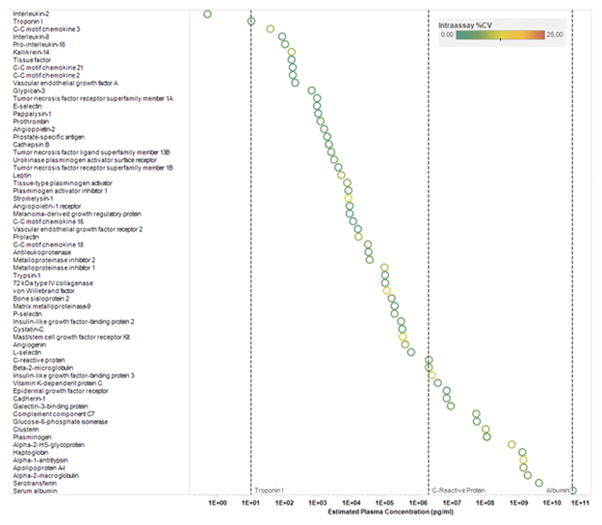
Figure 1. Intra-assay CVs of selected proteins.
Data represent intra-assay CVs of selected proteins across a broad range of plasma concentrations. Proteins are sorted by increasing plasma concentration reference range (http://www.plasmaproteome.org/plasmaframes.htm). The color of the circle represents intra-assay CV as denoted in the key above. See Supplemental Table 1 for full protein names, Entrez Gene symbol/ID and UniProt ID.

