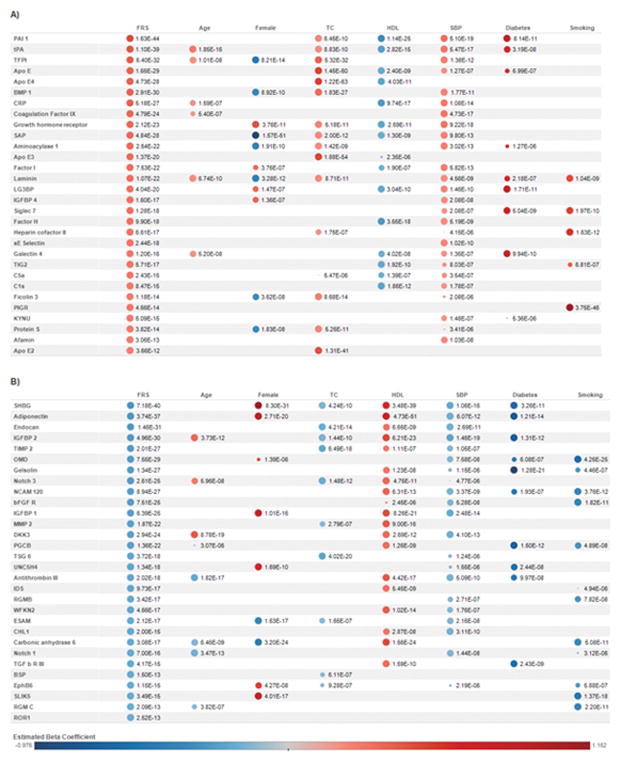
Figure 4. Top protein associations with the Framingham Risk Score (FRS) and component clinical traits.
Shown are the top 30 proteins with positive (Panel A) and negative (Panel B) associations. Within groups of positive/negative associations, proteins are sorted by ascending P. Estimated beta coefficients and P were generated from age- and sex- adjusted regression analyses of each protein (log transformed then standardized) with FRS and clinical traits (standardized). The size of the circles corresponds to P (larger circles represent smaller P). Protein-trait associations with P > 5.54E-06 were not represented by circles. The color of the circles represents estimated beta coefficients as denoted in the key above. Abbreviations: FRS: Framingham Risk Score, TC: total cholesterol, HDL: high-density lipoprotein, SBP: systolic blood pressure. Diabetes and current smoking status were categorical variables. See Supplemental Table 1 for full protein names, Entrez Gene symbol/ID and UniProt ID.

