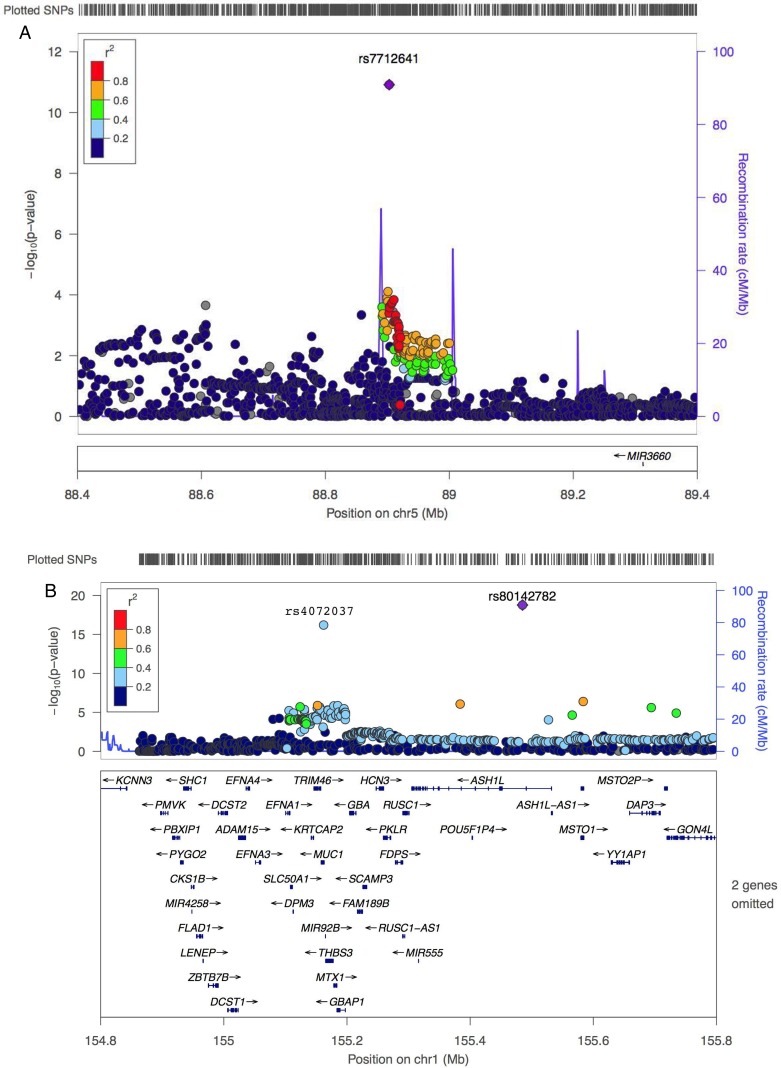
Figure 1.
Regional plots of association results (A) 5q14.3:88 400 000–89 400 000; (B) 1q22:152 940 379–153 897 376. Association results are based on a trend test in which –log10 p values (y axis, left) were plotted against the chromosomal positions based on hg19 (x axis). All p values were based on the discovery meta-analysis stage 1 data except for three index single-nucleotide polymorphisms (SNPs) (rs7712641 in 1a; rs80142782 and rs4072037 in (B) which were based on all data (stages 1, 2A and 2B). The line graph shows recombination rate (y axis, right). The linkage disequilibrium (LD) (r2) is colour-coded (figure legend) based on estimates from the 1000 Genomes Mar 2012 release Asian (ASN) population. The plots were generated using LocusZoom online version (URLs).

