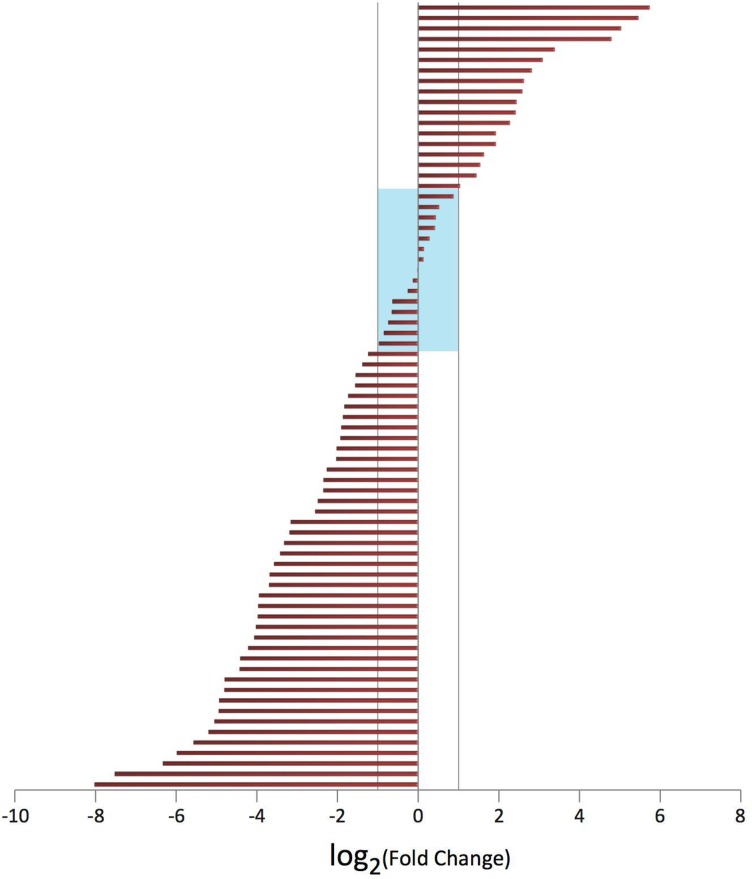
Figure 2.
Differential expression of lnc-POLR3G-4 between non-cardia gastric tumour and normal tissue based on a quantitative real-time PCR analysis. X axis is the log2 of tumour:normal fold change. All 75 pairs were sorted in increasing order of fold change and plotted along the Y axis. Two-thirds of pairs show lower expression in tumour compared with normal, while expression is higher in normal compared with tumour in one-third of pairs. Highlighted in the middle are 15 pairs with fold changes between 0.5 and 2 (or −1 to 1 in log2 scale). Based on all 75 pairs, the Wilcoxon signed-rank test was P=7.2×10⁻⁴ and the median tumour:normal fold change is 0.3.

