FIGURE 3.

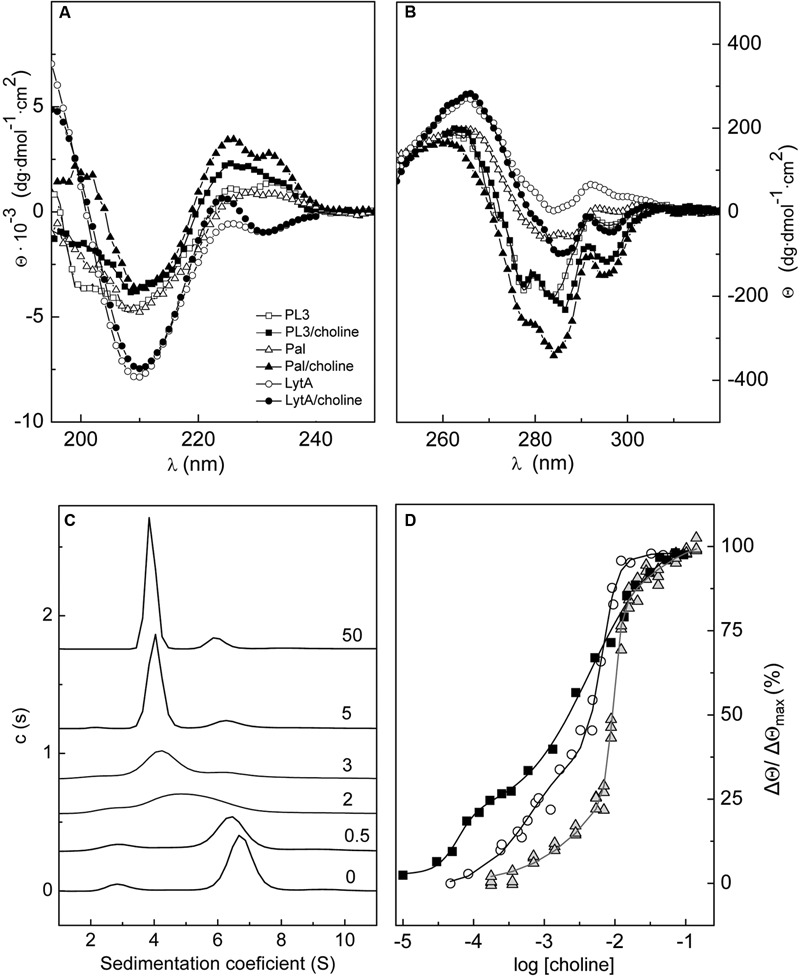
Effect of choline binding on PL3 structure. Comparison of the far- (A) and near-UV (B) CD spectra of PL3, Pal, and LytA in the absence and in the presence of 20 mM choline. (C) Effect of choline binding on PL3 association-state distribution. Increase of choline concentration shifts the monomer/dimer/tetramer equilibria of PL3 toward the dimer (s20,w = 4.1 S) with the concomitant decrease of monomer (s20,w = 3.0) and tetramer (s20,w = 6.8 S) populations. Labels indicate the choline concentration (mM). (D) CD titration curve of PL3 (squares) generated from the ellipticity changes induced at 295 nm by choline binding. Titration curves of LytA (circles; Varea et al., 2000) and Pal (triangles; Varea et al., 2004) are also depicted. Continuous lines represent the fitting of experimental data as the sum of two sigmoids with the parameters shown in Supplementary Table S1.
