

Abstract
Optical coherence tomography (OCT) is a novel image modality with higher resolution in the catheterization laboratory. It can differentiate tissue characteristics and provide detailed information, including dissection, tissue prolapse, thrombi, and stent apposition. In this study, we comprehensively reviewed the current pros and cons of OCT clinical applications and presented our clinical experiences associated with the advantages and limitations of this new imaging modality.
Keywords: Coronary artery disease, Optical coherence tomography
INTRODUCTION
Optical coherence tomography (OCT) was developed by Naohiro Tanno and James G. Fujimoto during the 1990s, and they first performed OCT on the retina and coronary artery in 1991.1 Coronary OCT uses only a single fiber optic wire that can both generate light and record the reflection while simultaneously rotating and pulling back in comparison to intravascular ultrasound (IVUS). In current OCT technology, optical echoes are analysed by near infra-red interferometry. In cardiology, OCT and IVUS are modern tools that contribute to the understanding of coronary artery disease and percutaneous coronary intervention (PCI). Nevertheless, OCT and IVUS differ in several aspects, as shown in Table 1. For instance, current coronary OCT systems use a central wavelength of approximately 1300 nm and tissue penetration of OCT is limited to 1 to 3 mm, compared with 4 to 8 mm with IVUS. Because the speed of light (3 × 10⁸ m/s) is much greater than that of sound (1,500 m/s), OCT as a fiber optic system offers 10 times greater resolution and 40 times faster image acquisition compared with IVUS. Because of the high attenuation of light by blood, complete removal of blood during OCT examination is necessary.
Table 1. Comparison of IVUS, TD-OCT and FD-OCT.
| Specifications | IVUS | TD-OCT | FD-OCT |
| Max. frame rate, fps | 30 | 20 | ~200 |
| Max. pullback speed, mm/s | 0.5-2.0 | 3 | 20 |
| Scan diameter (FOV), mm | 8-10 | 6.8 | ~6-11 |
| Axial resolution, μm | 100-150 | 15 | 10-15 |
| Lateral resolution, μm | 150-300 | 25-40 | 20-40 |
| Tissue penetration, mm | 4-8 | 1.5-3 | 2-3.5 |
| Balloon occlusion | No | Necessary | Optional |
| Catheter size, mm | 0.8-1.2 | 0.48 | 0.8-1.0 |
FD-OCT, frequency-domain optical coherence tomography; FOV, field of view; IVUS, intravascular ultrasound; TD-OCT, time-domain optical coherence tomography.
CURRENT OCT SYSTEM
Originally, the first-generation OCT was time-domain OCT (TD-OCT). In that system, TD-OCT requires balloon occlusion in proximal vessels to create a blood-free imaging environment. Previous studies have confirmed the safety of TD-OCT with balloon occlusion in comparison with IVUS. Nevertheless, the former is a complex procedure and its application is limited to ostial coronary disease.2-4 Currently, new generation OCT systems that implement frequency-domain OCT (FD-OCT) imaging methods have been developed to overcome such limitations.5,6
TIPS FOR INTRACORONARY IMAGE ACQUISITION
In Taiwan, the commercially available FD-OCT system uses a 2.7 Fr OCT catheter (Dragonfly imaging catheter, St. Jude Medical), a ≥ 6-Fr-diameter guide catheter is recommended. The OCT can be advanced to distal vessels via a standard 0.014-inch angioplasty guide wire. An automated pull back at a rate of 20 mm/s is started after blood clearance is achieved by non-diluted iodine contrast injection at rates of 3 to 5 mL/s for a total volume of 10 to 20 mL/pull back. The differences between TD-OCT and FD-OCT systems are shown in Table 1. In our experience, the fiber optic OCT catheter is softer and less amenable to pulling than the IVUS catheter, and even the diameter is less than IVUS. Before the operator advances the fiber optic catheter, some coronary lesions, such as diffuse, long, relatively calcified or bending lesions, should be well prepared to avoid breaking the fiber optic catheter. Moreover, OCT should be used to carefully coaxially guide the catheter position and measure firm catheter engagement in the coronary ostium to prevent residual blood attenuation (Figure 1A). Vessel sizes range from 2.0 mm to 3.75 mm in diameter, which is ideal for OCT imaging. Thus, operators should be aware of “out-of-screen” loss of image (Figure 1B), which is a result of the vessel size being larger than the scan diameter (field of view) of OCT, and fold-over artifacts. So far, ostial lesions of the main trunk are still a limitation of OCT due to poor blood washing and catheter engagement. We simply sum up our TIPS of OCT acquisition in Table 2.
Figure 1.
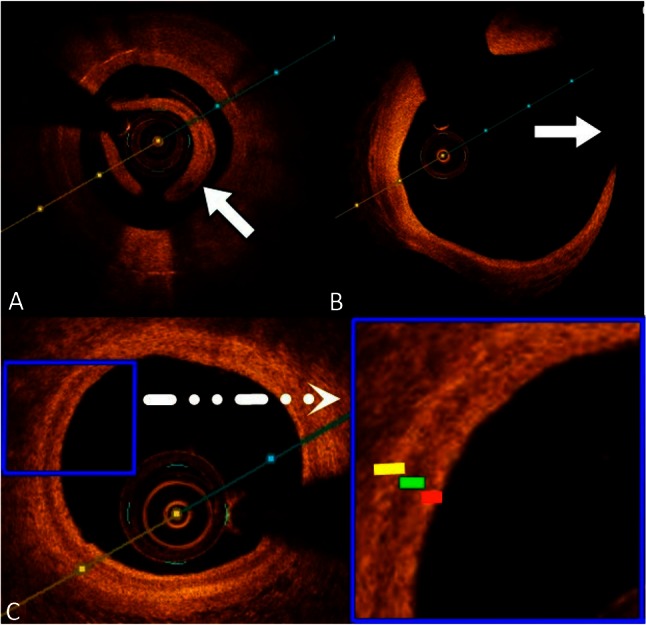
(A) Poor blood displacement causes light attenuation (white arrow). (B) The vessel size is larger than the scan diameter of optical coherence tomography (OCT), resulting in “out-of-screen” loss of image (white arrow). (C) OCT image clearly revealing the three layers of the vessel wall: high backscattering thin intima (red line), low backscattering media (green line), and heterogeneous adventitia (yellow line).
Table 2. Our experience in optical coherence tomography acquisition.
| 1. No using less than 6-Fr-diameter guide catheter. |
| 2. To advance a standard 0.014-inch angioplasty guide wire. |
| 3. Diffuse, long, relatively calcified or bending lesions, should be well prepared. |
| 4. The ideal vessel size is from 2.0 mm to 3.75 mm in diameter. |
| 5. To ensure firm catheter engagement with good coaxial alignment can avoid blood attenuation. |
| 6. To inject non-diluted iodine contrast injection at rates of 3 to 5 mL/s in 4 to 5 seconds. |
CLINICAL IMAGE INTERPRETATION
Because of its high resolution (10-15 μm), OCT can clearly distinguish between the three vessel walls: high backscattering thin intima, low backscattering media, and heterogeneous adventitia (Figure 1C). Fibrous tissue, collagen, and lipids have high birefringence, whereas calcium has low birefringence. Thus, different tissue structures can be distinguished by OCT because of their different composition. Different types of plaque demonstrate the following OCT image appearances: 1) fibrous plaque: a relatively homogeneous high signal region with low attenuation and mainly external elastic membrane; 2) calcified plaque: sharply delineated borders with a low-signal region; and 3) lipid-rich plaque: a low-signal region and poorly delineated borders with high attenuation (Figure 2A, 2B, 2C).7,8
Figure 2.
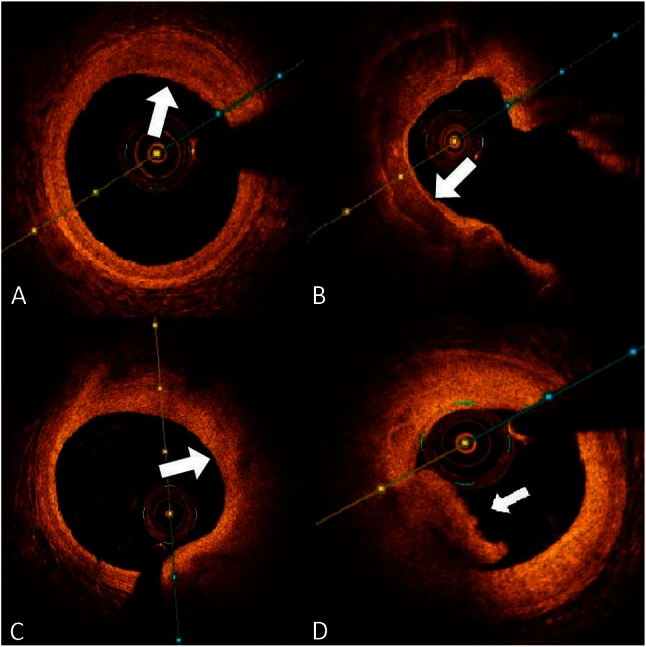
(A) A fibrous plaque displays the distinguishing feature of a homogenous high signal region (white arrow). (B) Calcified plaque has sharply delineated borders with a low signal region (white arrow). (C) Lipid-rich plaque contains poorly delineated borders with high attenuation and a low-signal region (white arrow). (D) The characteristic of optical coherence tomography (OCT) features of red thrombus composed mainly of red blood cells, is high-backscattering protrusions inside the vessel lumen (white arrow).
CLINICAL APPLICATIONS
More than 80% of clinically evident plaque ruptures originate within an inflamed thin-capped fibroatheroma.9 Autopsy studies have demonstrated that fibroatheroma with a thin fibrous cap of < 65 μm [thin-cap fibroatheroma (TCFA)] is associated with plaque rupture in acute coronary syndromes (ACS) and is considered a vulnerable plaque.10 Thus, it is crucial to perform aggressive medical treatment on TCFA patients to improve clinical outcomes. High-resolution OCT can identify a very thin (< 100 μm) fibrous cap covering a lipid core. TCFA, as imaged using OCT, is defined as a lipid-rich plaque (lipid arc within a plaque in ≥ 2 quadrants) with a thin fibrous cap (thickness at the thinnest segment < 65 μm).11 Additionally, OCT can assess plaque characteristics (such as rupture plaque, erosion plaque, red and white thrombi; Figure 2D) in ACS patients more precisely than IVUS.12,13 However, the low tissue penetration of current OCT systems is a major limitation and makes it difficult to distinguish tissue behind a thick cap, lipid core, or calcification.14
OCT-GUIDED PERCUTANEOUS CORONARY INTERVENTION
OCT is a utility that can precisely measure lesion length and vessel diameter in PCI, which is useful in optimizing the size of dilation balloons and stents. Because of the high resolution of OCT, the angle and location of the dissection flap are more accurately identified in OCT systems (Figure 3A). In addition, tissue prolapse, stent edge dissection, and stent malapposition (Figure 3B) can also be visualized in detail.15,16 A previous study has demonstrated that OCT has higher sensitivity than IVUS for assessing stent malapposition.17,18 Many studies have used OCT to demonstrate a delay in neointimal healing following drug eluting stent (DES) implantation compared with implantation of bare metal stents (BMS). Using OCT, second-generation DESs displayed better vascular healing than first-generation DESs.19,20 An autopsy study reported an excessive proportion (49%) of delayed healing at the culprit site in acute myocardial infarction (AMI) patients treated with DES, but the limitation of this study was the small number of specimens (N = 25).21 In contrast, compared with post-mortem data, OCT demonstrated a higher rate of vascular healing in both BMS and DES (uncovered struts: 0% vs. 1.98%, respectively).22 OCT is the preferred modality to study in-stent restenosis (ISR) characterization, and different tissue patterns have been described.23,24 Homogeneous fibrotic intimal hyperplasia is typically observed in BMS ISR (Figure 3C); conversely, heterogeneous neo-atherosclerosis caused by lipid accumulation and/or calcification is frequently reported in DES ISR (Figure 3D). In addition, the pathologic study of neo-atherosclerosis demonstrated that neo-atherosclerosis is a frequent finding in DES and occurs earlier than in BMS.25,26 Thus, OCT can disclose important information about plaque morphology covering the stent struts.
Figure 3.
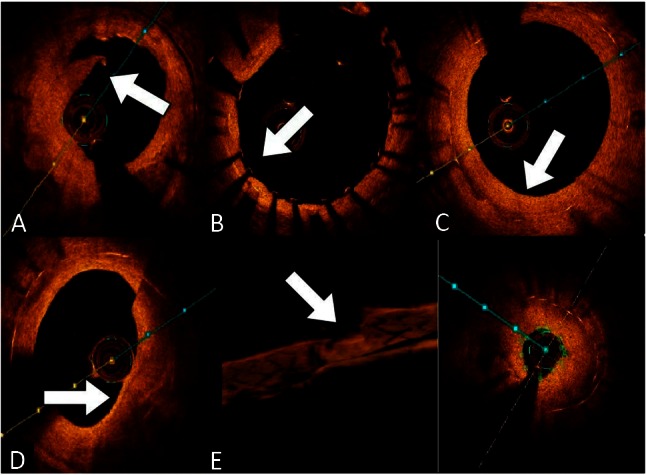
(A) Dissection flap (white arrow). (B) The stent fully expanded without stent malapposition (white arrow). (C) After 6 months of bare metal stent deployment, typical homogeneous fibrotic intimal hyperplasia developed (white arrow). (D) A heterogeneous neo-atherosclerosis, as well as a thin cap fibroatheroma, occurred 9 months after drug eluting stent deployment (white arrow). (E) Based on 3D optical coherence tomography (OCT) reconstruction images, a focal lipid-rich neo-atherosclerosis leads to severe in-stent restenosis (white arrow).
The three-dimensional (3D) reconstruction of IVUS was first described in 1995, but so far this technology has not shown an obvious, useful clinical application.27-30 In contrast, FD-OCT enables better 3D reconstruction of coronary vessels and stent struts because of faster frame rate, and unrivalled resolution and pullback speed.31 After the first application of 3D reconstruction of the human coronary artery,32 3D OCT reconstruction technology (Figure 3E) has promptly developed its clinical utility, such as for bifurcation lesion treatment, assessment of jailed side branches, and AMI management.33-38 However, real-time 3D reconstruction is not currently available in Taiwan and we do not have enough clinical experience to define the clinical impact of 3D OCT technology.
Everolimus-eluting bioresorbable vascular scaffolds (BVS) is a novel and promising treatment option for CAD.39-41 OCT can provide optimizing aid in pre-intervention planning of BVS according to accurate and automatic measurement of lesion length, calcification, plaque characteristics and vessel size. Additionally, stent structure, edge dissection, and stent malapposition in post-implantation assessment can also be visualized in detail via OCT.42
Regarding the one-year outcome of the CLI-OPCI study, it is an observational retrospective study which demonstrated OCT-guided PCI had a significantly lower one-year risk of cardiac death (1.2% vs. 4.5%, p = 0.010), cardiac death or MI (6.6% vs. 13.0%, p = 0.006), and the composite of cardiac death, MI, or repeat revascularization (9.6% vs. 14.8%, p = 0.044).43 Although OCT has superior resolution compared to IVUS, the outcome of OCT-guided PCI compared with IVUS guided PCI is unknown. The latest study of this issue is the ILUMIEN II study, which addressed that OCT-guidance was associated with comparable stent expansion, slightly greater in-segment % diameter stenosis, and similar rates of major stent malapposition, tissue protrusion, and stent edge dissection as IVUS-guidance.44 But this study has several limitations, such as retrospective comparison from 2 different study databases, and the techniques for IVUS and OCT guidance were not pre-specified. Thus, the results of angiography-guided, IVUS-guided and OCT-guided stent implantation will be established in ongoing prospective, multicenter ILUMIEN III: OPTIMIZE PCI randomized trial and OPINION study.45 We make a summing-up about our clinical experiences and current evidence of OCT vs IVUS, as shown in Table 3.
Table 3. Pros and cons of OCT versus IVUS.
| Instrument | OCT | IVUS |
| Pros | - Higher image resolution and 3D reconstruction. | - Higher tissue penetration. |
| - Apposition, dissection detecting and follow up. | ||
| - Rapid pullback less than 3 seconds. | - Plaque burden measuring. | |
| - Excellent lesion identification (lipid, calcium, fiber, thrombus). | - No more contrast flush. | |
| - Bioabsorbable stents. | - Big market penetration rate. | |
| - Complete patient outcome data. | ||
| - Real-time collaboration tool for re-entry in chronic total occlusion vessel. | ||
| Cons | - Insufficient patient outcome data. | - Lower image resolution. |
| - Left main coronary artery or right ostial coronary lesion. | - Inferior detection of lipid, thrombus, stents, dissections. | |
| - Poor tissue penetration. | - Over-reliance on operator experience. | |
| - Very tight or large lesions. | - Stent apposition. | |
| - Increase extra contrast load. | - Calcium shadowing influence. | |
| - Virtual histology reliability. |
IVUS, intravascular ultrasound; OCT, optical coherence tomography; PCI, percutaneous coronary intervention.
CONCLUSIONS
OCT is a newly available modern intravascular imaging modality in Taiwan. Because of its unrivalled resolution, interventional cardiologists can use it more precisely to evaluate clinical and research parameters of coronary artery disease.
CONFLICTS OF INTEREST
None.
REFERENCES
- 1.Huang D, Swanson EA, Lin CP, et al. Optical coherence tomography. Science. 1991;254.5035:1178–1181. doi: 10.1126/science.1957169. [DOI] [PMC free article] [PubMed] [Google Scholar]
- 2.Serruys PW, Ormiston JA, Onuma Y, et al. A bioabsorbable everolimus-eluting coronary stent system (ABSORB): 2-year outcomes and results from multiple imaging methods. Lancet. 2009;373:897–910. doi: 10.1016/S0140-6736(09)60325-1. [DOI] [PubMed] [Google Scholar]
- 3.Yamaguchi T, Terashima M, Akasaka T, et al. Safety and feasibility of an intravascular optical coherence tomography image wire system in the clinical setting. Am J Cardiol. 2008;101:562–567. doi: 10.1016/j.amjcard.2007.09.116. [DOI] [PubMed] [Google Scholar]
- 4.Kubo T, Imanishi T, Kitabata H, et al. Comparison of vascular response after sirolimus-eluting stent implantation between patients with unstable and stable angina pectoris: a serial optical coherence tomography study. JACC Cardiovasc Imaging. 2008;1:475–484. doi: 10.1016/j.jcmg.2008.03.012. [DOI] [PubMed] [Google Scholar]
- 5.Barlis P, Schmitt JM. Current and future developments in intra-coronary optical coherence tomography imaging. EuroIntervention. 2009;4:529–533. doi: 10.4244/eijv4i4a89. [DOI] [PubMed] [Google Scholar]
- 6.Takarada S, Imanishi T, Liu Y, et al. Advantage of next-generation frequency-domain optical coherence tomography compared with conventional time-domain system in the assessment of coronary lesion. Catheter Cardiovasc Interv. 2010;75:202–206. doi: 10.1002/ccd.22273. [DOI] [PubMed] [Google Scholar]
- 7.Yabushita H, Bouma BE, Houser SL, et al. Characterization of human atherosclerosis by optical coherence tomography. Circulation. 2002;106:1640–1645. doi: 10.1161/01.cir.0000029927.92825.f6. [DOI] [PubMed] [Google Scholar]
- 8.Kume T, Akasaka T, Kawamoto T, et al. Assessment of coronary arterial plaque by optical coherence tomography. Am J Cardiol. 2006;97:1172–1175. doi: 10.1016/j.amjcard.2005.11.035. [DOI] [PubMed] [Google Scholar]
- 9.Schaar JA, Muller JE, Falk E, et al. Terminology for high-risk and vulnerable coronary artery plaques. Report of a meeting on the vulnerable plaque, June 17 and 18, 2003, Santorini, Greece. Eur Heart J. 2004;25:1077–1082. doi: 10.1016/j.ehj.2004.01.002. [DOI] [PubMed] [Google Scholar]
- 10.Virmani R, Kolodgie FD, Burke AP, et al. Lessons from sudden coronary death a comprehensive morphological classification scheme for atherosclerotic lesions. Arterioscler Thromb Vasc Biol. 2000;20.5:1262–1275. doi: 10.1161/01.atv.20.5.1262. [DOI] [PubMed] [Google Scholar]
- 11.Jang IK, Tearney GJ, MacNeill B, et al. In vivo characterization of coronary atherosclerotic plaque by use of optical coherence tomography. Circulation. 2005;111:1551–1555. doi: 10.1161/01.CIR.0000159354.43778.69. [DOI] [PMC free article] [PubMed] [Google Scholar]
- 12.Kubo T, Imanishi T, Takarada S, et al. Assessment of culprit lesion morphology in acute myocardial infarction: ability of optical coherence tomography compared with intravascular ultrasound and coronary angioscopy. J Am Coll Cardiol. 2007;50:933–939. doi: 10.1016/j.jacc.2007.04.082. [DOI] [PubMed] [Google Scholar]
- 13.Kume T, Akasaka T, Kawamoto T, et al. Assessment of coronary arterial thrombus by optical coherence tomography. Am J Cardiol. 2006;97:1713–1717. doi: 10.1016/j.amjcard.2006.01.031. [DOI] [PubMed] [Google Scholar]
- 14.Manfrini O, Mont E, Leone O, et al. Sources of error and interpretation of plaque morphology by optical coherence tomography. Am J Cardiol. 2006;98:156–159. doi: 10.1016/j.amjcard.2006.01.097. [DOI] [PubMed] [Google Scholar]
- 15.Gonzalo N, Serruys PW, Okamura T, et al. Optical coherence tomography assessment of the acute effects of stent implantation on the vessel wall: a systematic quantitative approach. Heart. 2009;95:1913–1919. doi: 10.1136/hrt.2009.172072. [DOI] [PubMed] [Google Scholar]
- 16.Chamié D, Bezerra HG, Attizzani GF, et al. Incidence, predictors, morphological characteristics, and clinical outcomes of stent edge dissections detected by optical coherence tomography. JACC Cardiovasc Interv. 2013;6.8:800–813. doi: 10.1016/j.jcin.2013.03.019. [DOI] [PubMed] [Google Scholar]
- 17.Bouma BE, Tearney GJ, Yabushita H, et al. Evaluation of intracoronary stenting by intravascular optical coherence tomography. Heart. 2003;89:317–320. doi: 10.1136/heart.89.3.317. [DOI] [PMC free article] [PubMed] [Google Scholar]
- 18.Bezerra HG, Attizzani GF, Sirbu V, et al. Optical coherence tomography versus intravascular ultrasound to evaluate coronary artery disease and percutaneous coronary intervention. JACC Cardiovasc Interv. 2013;6.3:228–236. doi: 10.1016/j.jcin.2012.09.017. [DOI] [PubMed] [Google Scholar]
- 19.Kim JS, Jang IK, Kim JS, et al. Optical coherence tomography evaluation of zotarolimus-eluting stents at 9-month follow-up: comparison with sirolimus-eluting stents. Heart. 2009;95:1907–1912. doi: 10.1136/hrt.2009.167759. [DOI] [PMC free article] [PubMed] [Google Scholar]
- 20.Choi HH, Kim JS, Yoon DH, et al. Favorable neointimal coverage in everolimus-eluting stent at 9 months after stent implantation: comparison with sirolimus-eluting stent using optical coherence tomography. Int J Cardiovasc Imaging. 2012;28.3:491–497. doi: 10.1007/s10554-011-9849-7. [DOI] [PubMed] [Google Scholar]
- 21.Nakazawa G, Finn AV, Joner M, et al. Delayed arterial healing and increased late stent thrombosis at culprit sites after drug-eluting stent placement for acute myocardial infarction patients: an autopsy study. Circulation. 2008;118:1138–1145. doi: 10.1161/CIRCULATIONAHA.107.762047. [DOI] [PubMed] [Google Scholar]
- 22.Guagliumi G, Sirbu V, Bezerra H, et al. Strut coverage and vessel wall response to zotarolimus-eluting and bare-metal stents implanted in patients with ST-segment elevation myocardial infarction: the OCTAMI (Optical Coherence Tomography in Acute Myocardial Infarction) Study. JACC Cardiovasc Interv. 2010;3.6:680–687. doi: 10.1016/j.jcin.2010.04.005. [DOI] [PubMed] [Google Scholar]
- 23.Prati F, Regar E, Mintz GS, et al. Expert review document on methodology, terminology, and clinical applications of optical coherence tomography: physical principles, methodology of image acquisition, and clinical application for assessment of coronary arteries and atherosclerosis. Eur Heart J. 2010;31:401–415. doi: 10.1093/eurheartj/ehp433. [DOI] [PubMed] [Google Scholar]
- 24.Gonzalo N, Serruys PW, Okamura T, et al. Optical coherence tomography patterns of stent restenosis. Am Heart J. 2009;158:284–293. doi: 10.1016/j.ahj.2009.06.004. [DOI] [PubMed] [Google Scholar]
- 25.Bossi I, Klersy C, Black AJ, et al. In-stent restenosis: long-term outcome and predictors of subsequent target lesion revascularization after repeat balloon angioplasty. J Am Coll Cardiol. 2000;35:1569–1576. doi: 10.1016/s0735-1097(00)00584-2. [DOI] [PubMed] [Google Scholar]
- 26.Nakazawa G, Otsuka F, Nakano M, et al. The pathology of neoatherosclerosis in human coronary implants bare-metal and drug-eluting stents. J Am Coll Cardiol. 2011;57:1314–1322. doi: 10.1016/j.jacc.2011.01.011. [DOI] [PMC free article] [PubMed] [Google Scholar]
- 27.Reid DB, Douglas M, Diethrich EB. The clinical value of three-dimensional intravascular ultrasound imaging. J Endovasc Surg. 1995;2:356–364. doi: 10.1583/1074-6218(1995)002<0356:TCVOTD>2.0.CO;2. [DOI] [PubMed] [Google Scholar]
- 28.Box LC, Angiolillo DJ, Suzuki N, et al. Heterogeneity of atherosclerotic plaque characteristics in human coronary artery disease: a three-dimensional intravascular ultrasound study. Catheter Cardiovasc Interv. 2007;70:349–356. doi: 10.1002/ccd.21088. [DOI] [PubMed] [Google Scholar]
- 29.Schaar JA, Regar E, Mastik F, et al. Incidence of high-strain patterns in human coronary arteries: assessment with three-dimensional intravascular palpography and correlation with clinical presentation. Circulation. 2004;109:2716–2719. doi: 10.1161/01.CIR.0000131887.65955.3B. [DOI] [PubMed] [Google Scholar]
- 30.van Ooijen PM, de Jonge G, Oudkerk M, et al. Coronary fly-through or virtual angioscopy using dual-source MDCT data. Eur Radiol. 2007;17:2852–2859. doi: 10.1007/s00330-007-0681-3. [DOI] [PMC free article] [PubMed] [Google Scholar]
- 31.Yun S, Tearney G, de Boer J, et al. High-speed optical frequency domain imaging. Opt Express. 2003;11:2953–2963. doi: 10.1364/oe.11.002953. [DOI] [PMC free article] [PubMed] [Google Scholar]
- 32.Tearney GJ, Waxman S, Shishkov M, et al. Three-dimensional coronary artery microscopy by intracoronary optical frequency domain imaging. JACC Cardiovasc Imaging. 2008;1:752–761. doi: 10.1016/j.jcmg.2008.06.007. [DOI] [PMC free article] [PubMed] [Google Scholar]
- 33.Okamura T, Onuma Y, Garcia-Garcia HM, et al. 3-Dimensional optical coherence tomography assessment of jailed side branches by bioresorbable vascular scaffolds: a proposal for classification. JACC Cardiovasc Interv. 2010;3:836–844. doi: 10.1016/j.jcin.2010.05.011. [DOI] [PubMed] [Google Scholar]
- 34.Farooq V, Serruys PW, Heo JH, et al. New insights into the coronary artery bifurcation. Hypothesis-generating concepts utilizing 3-dimensional optical frequency domain imaging. JACC Cardiovasc Interv. 2011;4:921–931. doi: 10.1016/j.jcin.2011.06.004. [DOI] [PubMed] [Google Scholar]
- 35.Okamura T, Serruys PW, Regar E. Three-dimensional visualization of intracoronary thrombus during stent implantation using the second generation, Fourier domain optical coherence tomography. Eur Heart J. 2009;31:625. doi: 10.1093/eurheartj/ehp519. [DOI] [PMC free article] [PubMed] [Google Scholar]
- 36.Di Mario C, Iakovou I, van der Giessen WJ, et al. Optical coherence tomography for guidance in bifurcation lesion treatment. EuroIntervention. 2011;6:J99–J106. doi: 10.4244/EIJV6SUPJA16. [DOI] [PubMed] [Google Scholar]
- 37.van Geuns RJ, Gogas BD, Farooq V, et al. 3-Dimensional reconstruction of a bifurcation lesion with double wire after implantation of a second generation everolimus-eluting bioresorbable vascular scaffold. Int J Cardiol. 2011;153.2:e43–e45. doi: 10.1016/j.ijcard.2011.02.008. [DOI] [PubMed] [Google Scholar]
- 38.Gogas BD, Farooq V, Onuma Y, et al. 3-Dimensional optical frequency domain imaging for the evaluation of primary percutaneous coronary intervention in ST-segment elevation myocardial infarction. Int J Cardiol. 2011;151:103–105. doi: 10.1016/j.ijcard.2011.06.016. [DOI] [PubMed] [Google Scholar]
- 39.Serruys PW, Onuma Y, Ormiston JA, et al. Evaluation of the second generation of a bioresorbable everolimus drugeluting vascular scaffold for the treatment of de novo coronary artery stenosis: six-month clinical and imaging outcomes. Circulation. 2010;122:2301–2312. doi: 10.1161/CIRCULATIONAHA.110.970772. [DOI] [PubMed] [Google Scholar]
- 40.Abizaid A, Ribamar Costa J, Jr., Bartorelli AL, et al. The ABSORB EXTEND study: preliminary report of the twelve-month clinical outcomes in the first 512 patients enrolled. EuroIntervention. 2014;29:20130827-06. doi: 10.4244/EIJV10I12A243. [DOI] [PubMed] [Google Scholar]
- 41.Brown AJ, McCormick LM, Braganza DM, et al. Expansion and malapposition characteristics after bioresorbable vascular scaffold implantation. Catheter Cardiovasc Interv. 2014;84.1:37–45. doi: 10.1002/ccd.25378. [DOI] [PubMed] [Google Scholar]
- 42.Allahwala UK, Cockburn JA, Shaw E, et al. Clinical utility of optical coherence tomography (OCT) in the optimization of Absorb bioresorbable vascular scaffold deployment during percutaneous coronary intervention. EuroIntervention. 2015;10.11:1154–1159. doi: 10.4244/EIJV10I10A190. [DOI] [PubMed] [Google Scholar]
- 43.Prati F, Di Vito L, Biondi-Zoccai G, et al. Angiography alone versus angiography plus optical coherence tomography to guide decision-making during percutaneous coronary intervention: the Centro per la Lotta contro l’Infarto-Optimisation of Percutaneous Coronary Intervention (CLI-OPCI) study. EuroIntervention. 2012;8.7:823–829. doi: 10.4244/EIJV8I7A125. [DOI] [PubMed] [Google Scholar]
- 44.Stone GW. ILUMIEN II: comparison of stent expansion guided by optical coherence tomography and intravascular ultrasound. Paris, France: Presented at: EuroPCR; May 20, 2015. [Google Scholar]
- 45.Akasaka T. OPINION: OPtical frequency domain imaging versus INtravascular ultrasound in percutaneous coronary InterventiON. Paris, France: Presented at: EuroPCR; May 20, 2015. [Google Scholar]