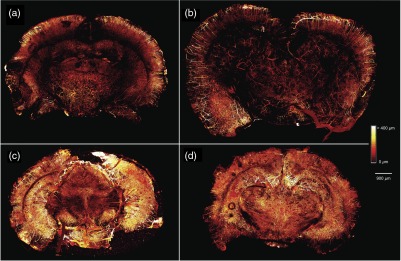
Fig. 5.
Maximum intensity projection (MIP) maps of tissue microvasculature in 1-mm brain slices optically cleared for (a) 1 h, (b) 3 h, (c) 6 h, and (d) 24 h showing the increased density of vasculature that can be visualized with increasing optical clearing time. MIP images are constructed by determining the maximum intensity pixel at each pixel location from all of the image slices in a confocal microscopy image stack and projecting these pixels onto a two-dimensional (2-D) image. Each pixel is assigned a color corresponding to the originating slice in the image stack resulting in a depth-encoded MIP map that gives three-dimensional information in a 2-D image.

