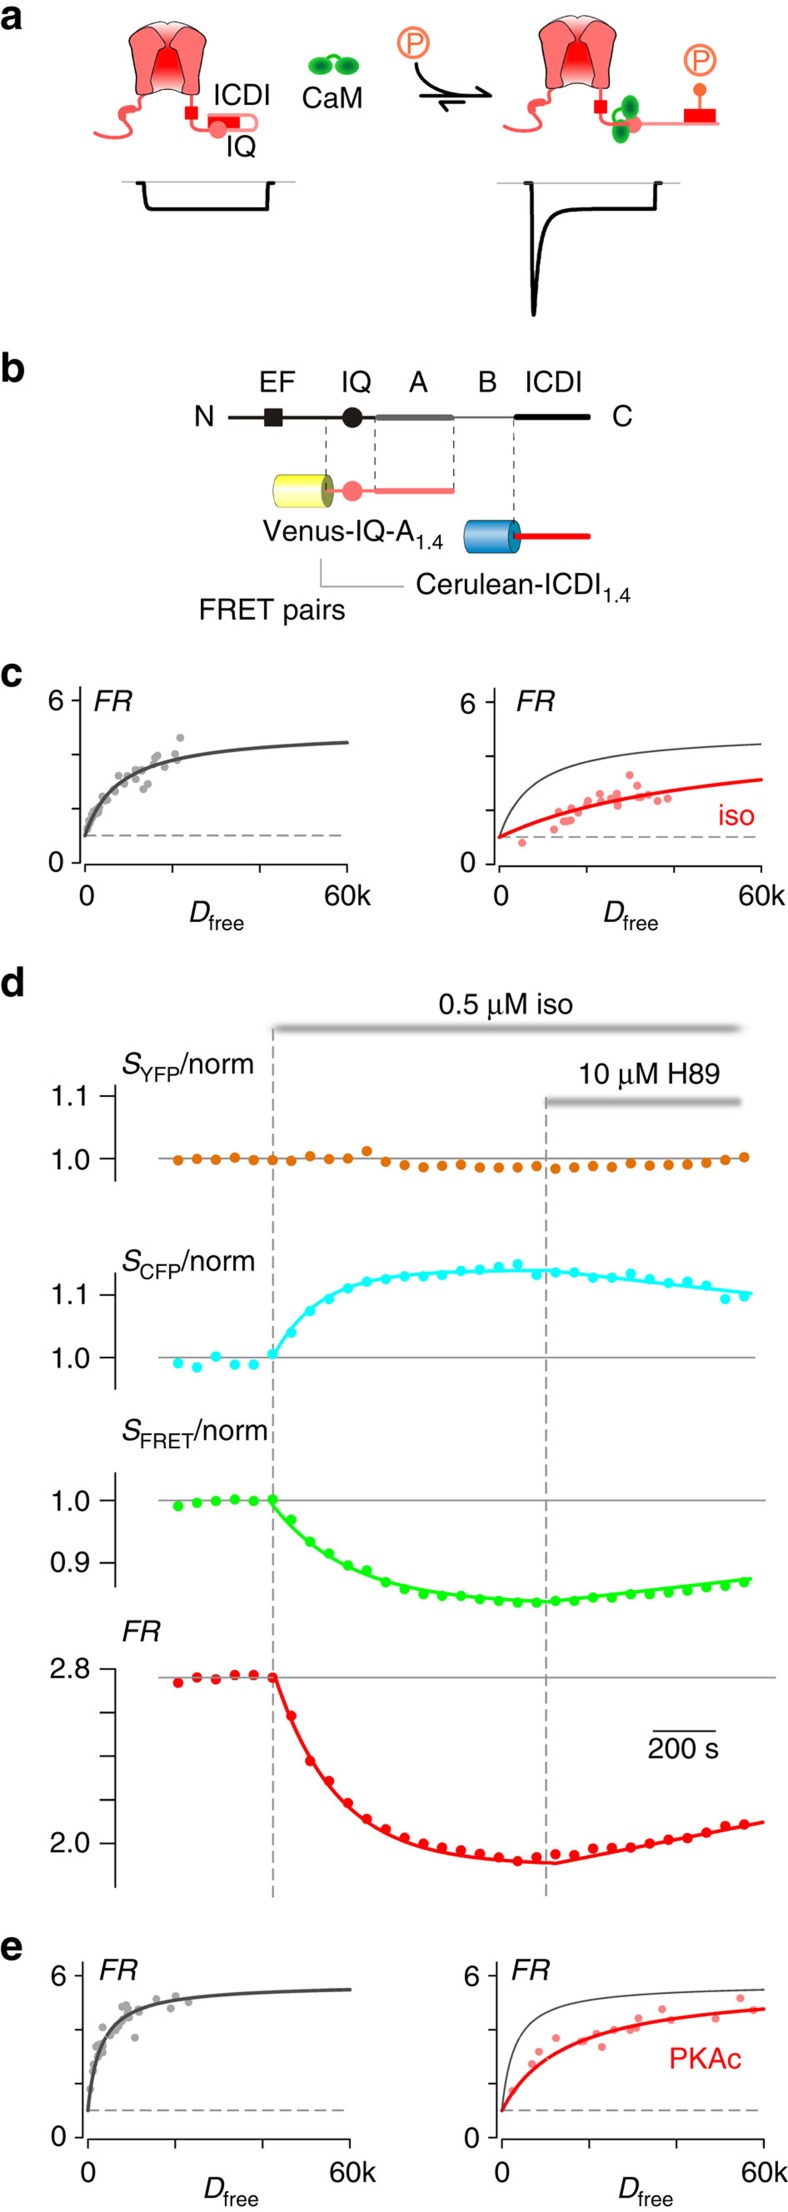
Figure 2. PKA regulation of the interaction between IQ and ICDI domains in CaV1.4.
(a) PKA regulation of L-type Ca2+ channel calmodulation. Left: ICDI module (red rectangle) on the DCT of the channel interacts with the IQ domain (pink circle) and dislodges CaM (green dumbbell). Without CaM, channels have low PO and minimal CDI (idealized current underneath the cartoon). Right: PKA phosphorylation (orange lollipop) could weaken the IQ/ICDI interaction and allow CaM to rebind, thus increasing channel PO and CDI. (b) Diagram of the C-tail of the channel illustrating the relevant FRET pairs, Venus-tagged IQ-A domains and Cerulean-tagged ICDI domain from CaV1.4. (c) FRET binding curve for Venus-IQ-A1.4 paired with Cerulean-ICDI1.4 in aGPVMs (grey). Isoproterenol (0.5 μM iso; red) decreases the relative binding affinity. Each point indicates a single cell. The control binding curve is replicated as the grey curve in the right-hand panel here and throughout. FR, FRET ratio; Dfree, relative concentration of unbound Cerulean-tagged ICDI1.4. (d) Kinetics of normalized fluorescent signals from YFP channel (SYFP), CFP channel (SCFP), FRET channel (SFRET) and calculated FR from an exemplar aGPVM expressing Venus-IQ-A1.4 and Cerulean-ICDI1.4, with 0.5 μM isoproterenol and 10 μM H89 added as indicated. Fluorescent signals were normalized to baseline. (e) FRET binding curve for Venus-IQ-A1.4 paired with Cerulean-ICDI1.4 in HEK293 cells (grey). Overexpression of PKAc (red) reduces the binding.

