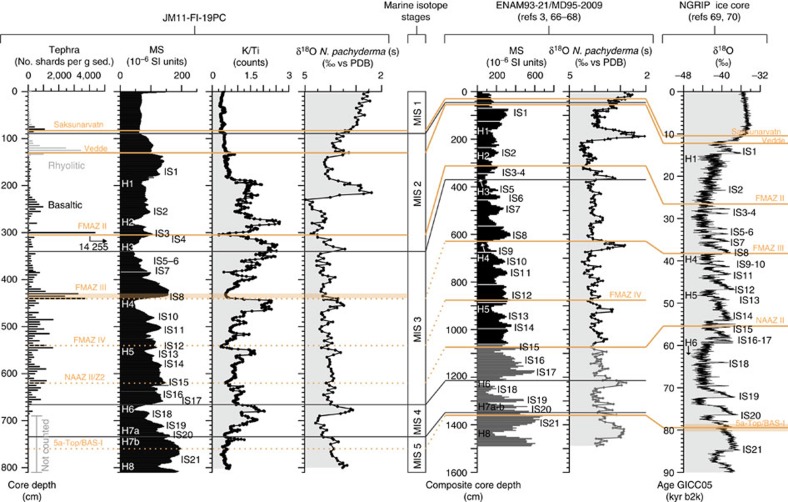
Figure 2. Stratigraphic correlation of JM11-FI-19PC to nearby marine core ENAM93-21/MD95-2009 and the NGRIP ice core.
Tephra layers are shown in orange (solid lines, used in age model calculations; dashed lines, not used in age model calculations; see explanations to Supplementary Table 2). Basaltic tephra counts for JM11-FI-19PC are shown in black bars, while rhyolitic tephra counts are shown in light grey bars. Orange shaded bar at the FMAZ III tephra from core JM11-FI-19PC indicate depth range of the tephra zone (see explanations to Supplementary Table 2). Orange shaded bar at the 5a-Top/BAS-I tephra layer in data from the NGRIP ice core indicates uncertainty in age for this tephra layer (see explanations to Supplementary Table 2). H, H-event; K/Ti, XRF measurement of the ratio between potassium and titanium; MS, Magnetic susceptibility; δ18O N. pachyderma s, planktic foraminiferal species. Data from sediment (sed.) cores ENAM93-21/MD95-2009 are from refs 3, 66, 67, 68, while NGRIP ice core data are from refs 69, 70.

