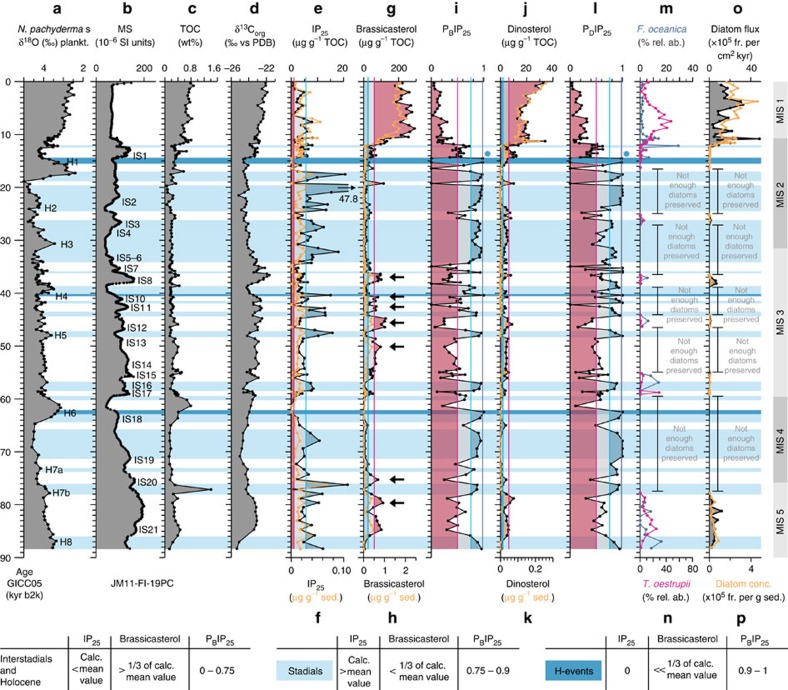
Figure 5. Proxy data of sediment core JM11-FI-19PC 90 kyr b2k to present.
(a) δ18O measured in planktic foraminiferal species N. pachyderma s (‰ versus (vs) Pee Dee Belemnite (PDB)), (b) MS (10−6 SI units), (c) TOC (% of dry weight sediment), (d) δ13Corg (‰ vs PDB), (e) IP25 (μg g−1 TOC, black) and (f) (μg g−1 sediment (sed.), orange), (g) brassicasterol (μg g−1 TOC, black) and (h) (μg g−1 (i) calculated index PBIP25 (brassicasterol), (j) dinosterol (μg g−1 black) and (k) (μg g−1, (l) calculated index PDIP25 (dinosterol), (m) relative abundance of diatom species Fragilariopsis oceanica (Cleve) Hasle (%, blue), (n) relative abundance of diatom species Thalassiosira oestrupii (Ostenfeld) Hasle (%, magenta), (o) diatom flux (1005 frustules (fr.) per cm2 per kyr, black) and (p) diatom concentrations (1005 frustules per g sed., orange), and MIS are shown. Vertical lines in IP25, brassicasterol and PBIP25 mark the cutoff values of sea ice cover stages26,27. Legend at the bottom of the figure show cutoff values of IP25 (μg g−1 TOC), brassicasterol (μg g−1 TOC) and PBIP25 as criteria of the interpretation of IP25, brassicasterol, dinosterol, PBIP25 and PDIP25 in terms of degree of sea ice cover. Brassicasterol values (as proxy for open-water phytoplankton productivity) are in great accordance with the dinosterol numbers, therefore only values for brassicasterol are shown. Zero or near-zero concentrations of both IP25 as well as phytoplankton biomarkers are indicative for a closed (spring) sea ice cover (PIP25 in general is indeterminable and per definition set to ‘1' (refs 15, 26); see PBIP25 and PDIP25 during H1, marked by blue stars). Arrows mark events of increased productivity during IS cooling phases (see text for explanation). H, H-event; ‘not enough diatoms preserved', in these intervals there were not enough diatoms preserved to be quantified after the set criteria (see Methods).

