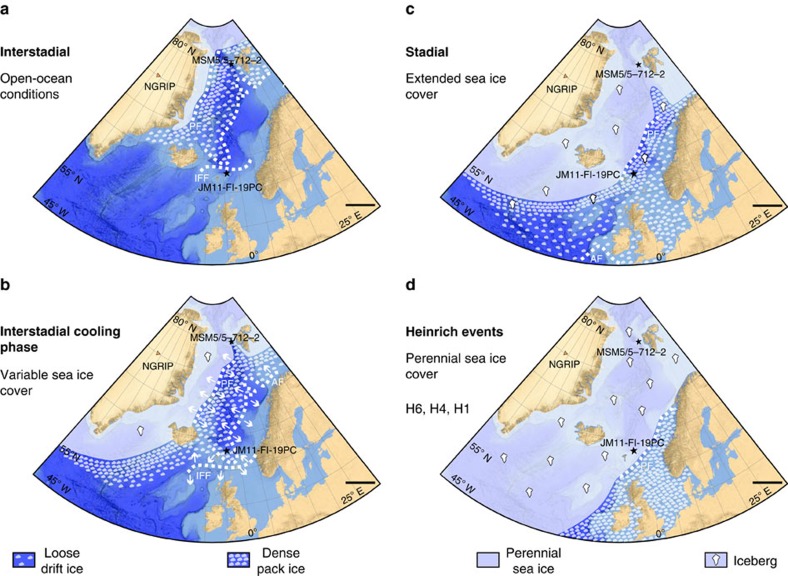
Figure 7. Reconstructed sea ice distribution during D/O events in the Nordic seas.
The figure is based on published records with sufficient time resolution to identify individual D/O events of MIS 5 to MIS 2. We have included only records that contain counts of ice-rafted debris (IRD) in combination with planktic δ18O values and/or surface temperature proxies based on planktic foraminifera (transfer functions and/or % N. pachyderma). From areas that are well covered with a high number of records, we have selected a few considered as representative. For areas with sparse coverage and low resolution (such as central basins), we chose a few records, where the results may be based on other or fewer proxies (Supplementary Table 1). For locations of the published records and references, see Supplementary Fig. 1. (a) Interstadial with open-ocean conditions. The Arctic Front (AF), Iceland-Faroe Front (IFF) and Polar Front (PF) are located north of the core location. (b) Interstadial transitional cooling phase with variable sea ice cover and variable positions of AF (IFF) and PF, which is indicated by white arrows. The core location is always between AF and PF. (c) Stadial with extended sea ice cover. The core location is again between AF and PF, but markedly closer to PF (potentially PF can be south of the core location; see text). Both fronts are located further towards the south compared with interstadial and interstadial cooling conditions. (d) H-events (H6, H4 and H1) with perennial sea ice cover. Both Fronts, AF and PF, are now located south of the core location. Stars mark the location of the studied core JM11-FI-19PC, as well as the location of core MSM5/5-712-217 used for comparison; dashed white lines give approximate positions of fronts AF (IFF) and PF. The reconstructions of regional distribution of sea ice cover are based on published records together with the records of JM11-FI-19PC and MSM5/5-712-217 (Supplementary Fig. 1, Supplementary Table 1 and Supplementary References). Bathymetry from GEBCO 2014 grid (http://www.gebco.net/). NGRIP, North Grip ice core (orange triangle). Scale bar, 500 km.

