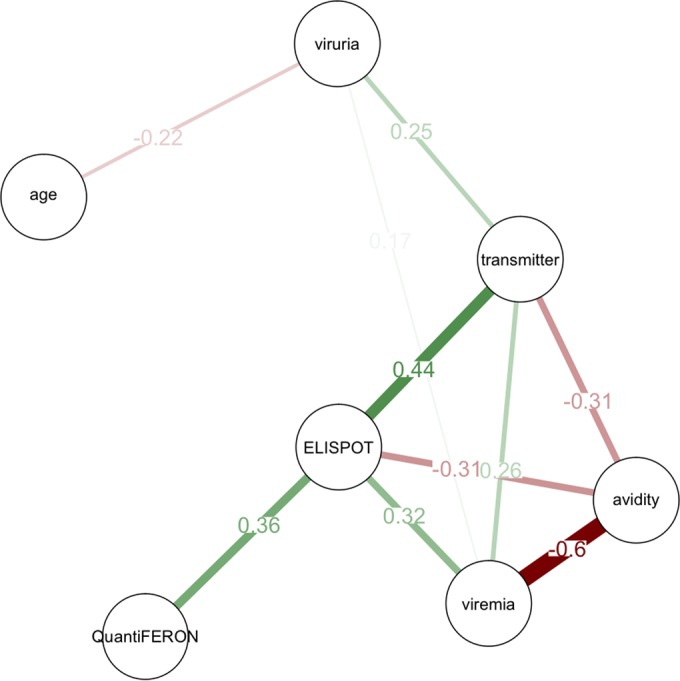
FIG 1.

Graphical representation of the factors associated with congenital CMV transmission. Green lines indicate a positive correlation, while red lines indicate a negative correlation. The thickness of the lines and intensity of the color are directly proportional to the significance. The numbers indicated within the connecting lines represent the correlation coefficients. The distance between nodes is proportional to the degree of correlation.
