
FIG 3.
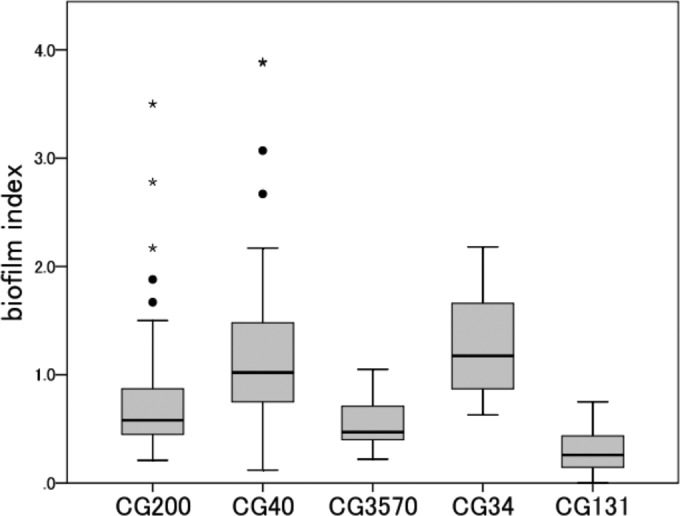
Comparison of biofilm index values for five groups. The biofilm index was defined as the average optical density (OD570). Boxplots show the medians (horizontal lines) and the 10th, 25th, 75th, and 90th percentiles (boxes and whiskers). ●, outliers; ⭑, extreme values. The numbers in the five groups were as follows: CG200, 29 strains; CG40, 49 strains; CG3570, 16 strains; CG34, 10 strains; CG131, 35 strains. The average biofilm index for EAEC 042, which was used as the positive control, was 3.61.