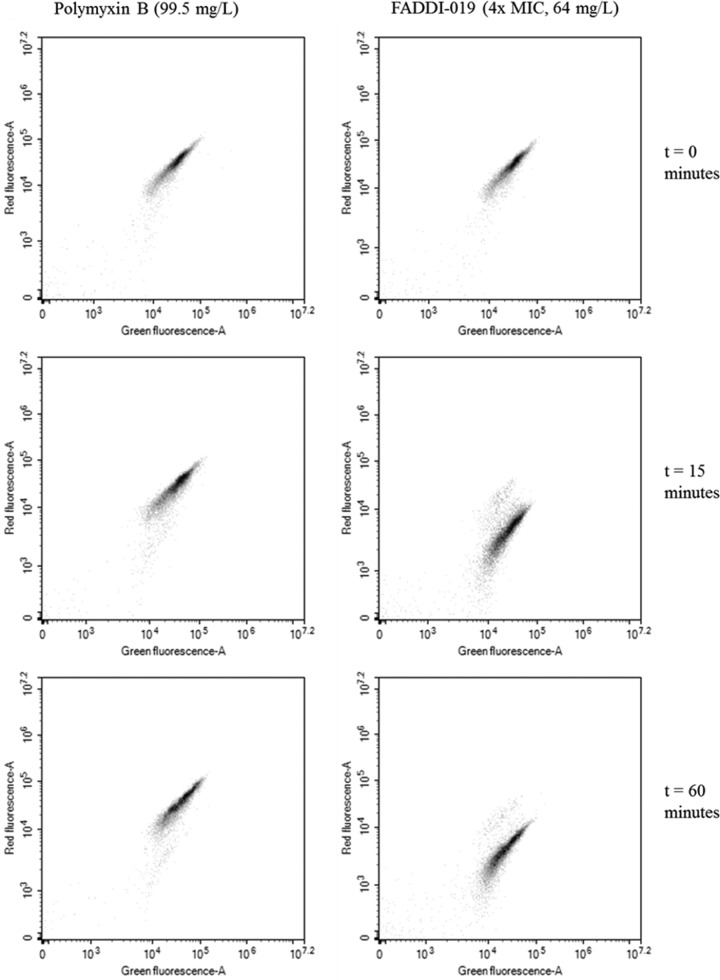
FIG 3 .
Scatter plots of flow cytometry analysis of S. aureus ATCC 70099 during treatment with polymyxin B and FADDI-019. DiOC2(3) was used to stain the cells, and the fluorescence of each incident (indicated as a dot) in the red and green channels was measured and plotted onto a 2-D scatterplot. Shifting of the scatter in the red fluorescence channel is indicative of membrane depolarization.

