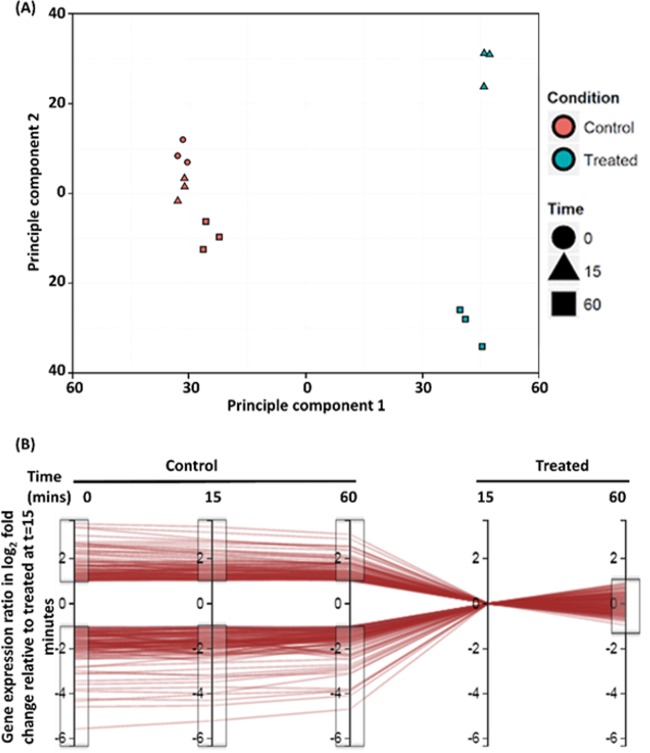
FIG 4 .
(A) PCA results for all data, with individual samples plotted on principal component 1 (horizontal axis) and principal component 2 (vertical axis). (B) Graphical representation of the gene enrichment process using Degust. Individual differentially regulated genes are represented as horizontal red lines. The vertical axes represent the log2 fold change of all genes at each time point in control and treated conditions (indicated above each axis) relative to 15 min of treatment with FADDI-019. Gray boxes indicate the gating cutoffs used to enrich the gene list for genes that are greater than 1 log2 fold differentially expressed throughout the control samples but >1 log2 fold differentially expressed after 60 min.

