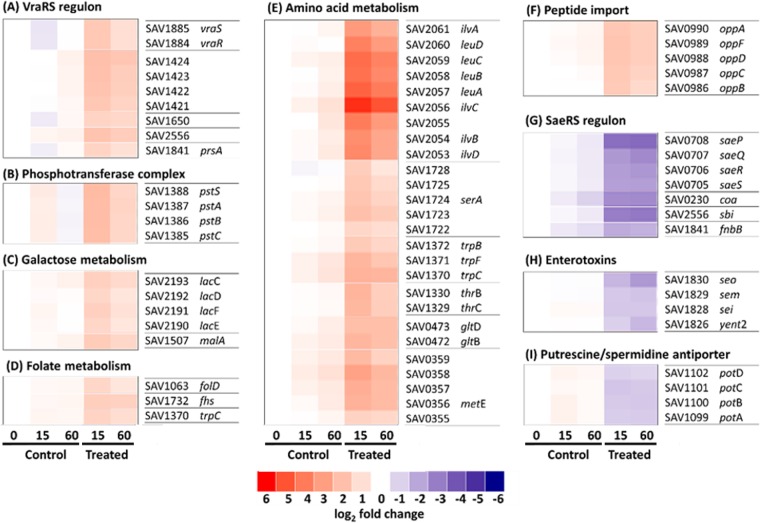
FIG 5 .
(A to I) Heat map representation of gene expression relative to that in the control at time zero. Gene numbers and annotations are displayed adjacent to each map. Red-to-blue colors represent the log2 fold change, ranging from 6(log2)-fold upregulated (red) through no change (white) to −6(log2)-fold change (blue). Each map was generated using data from three biological repeats, and all genes represented have a >2-fold change in expression after 15 min of treatment relative to their expression in control samples.

