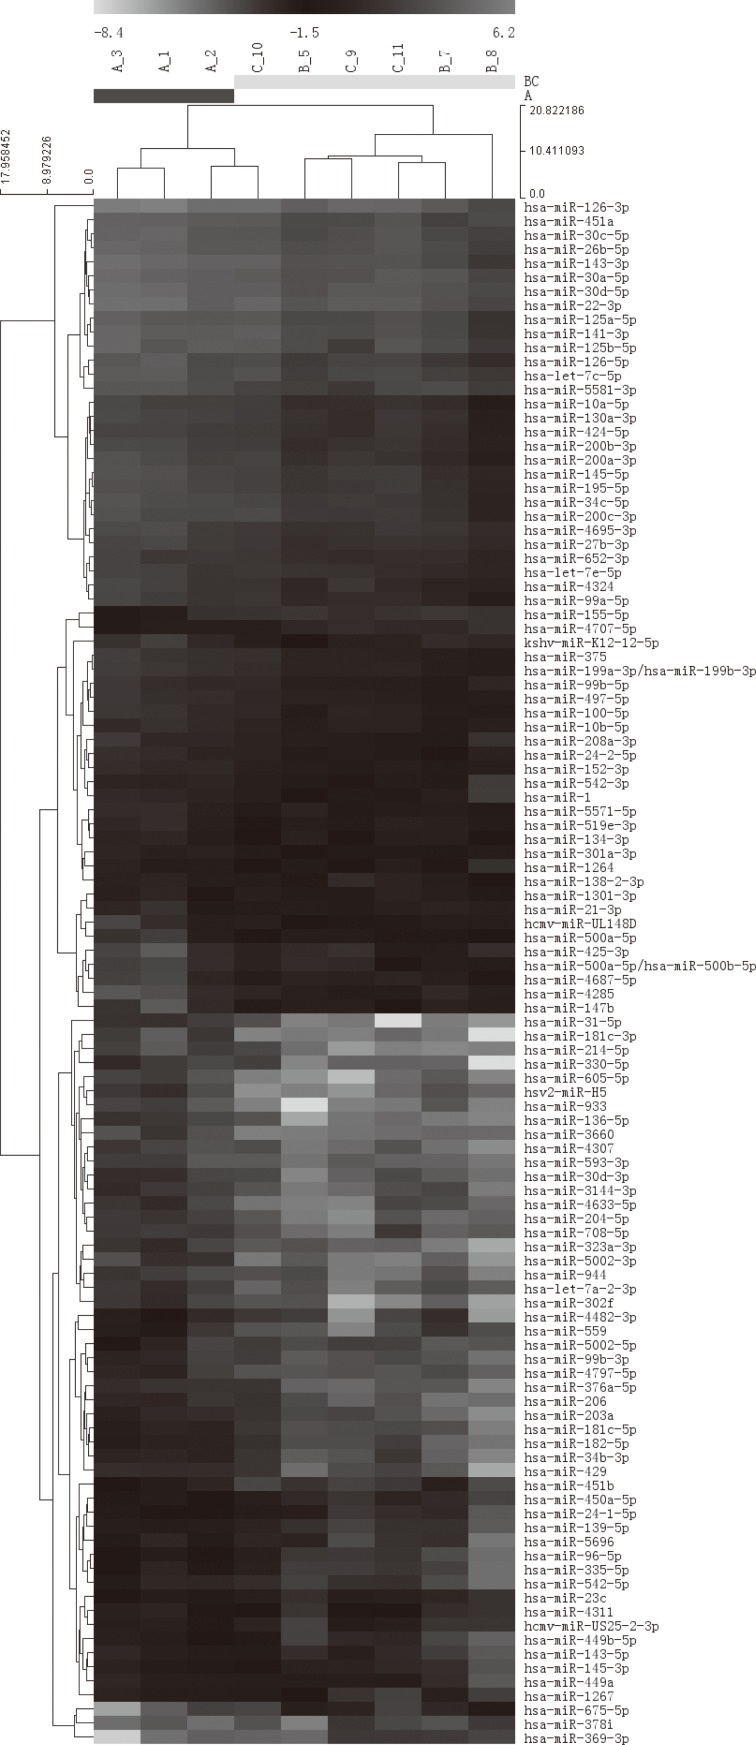
Fig. 1.
Hierarchical clustering for differentially expressed miRNA in silicosis group and observation subjects pass Volcano Plot (Fold Change>=2, each row represents a miRNA and each column represents a sample. 9 samples were clustered according to the expression profile of 110 differentially expressed miRNAs. The miRNA clustering tree is shown on the left, and the sample clustering tree appears at the top. Red color represents a high relative expression level; green color represents a low relative expression level. )

