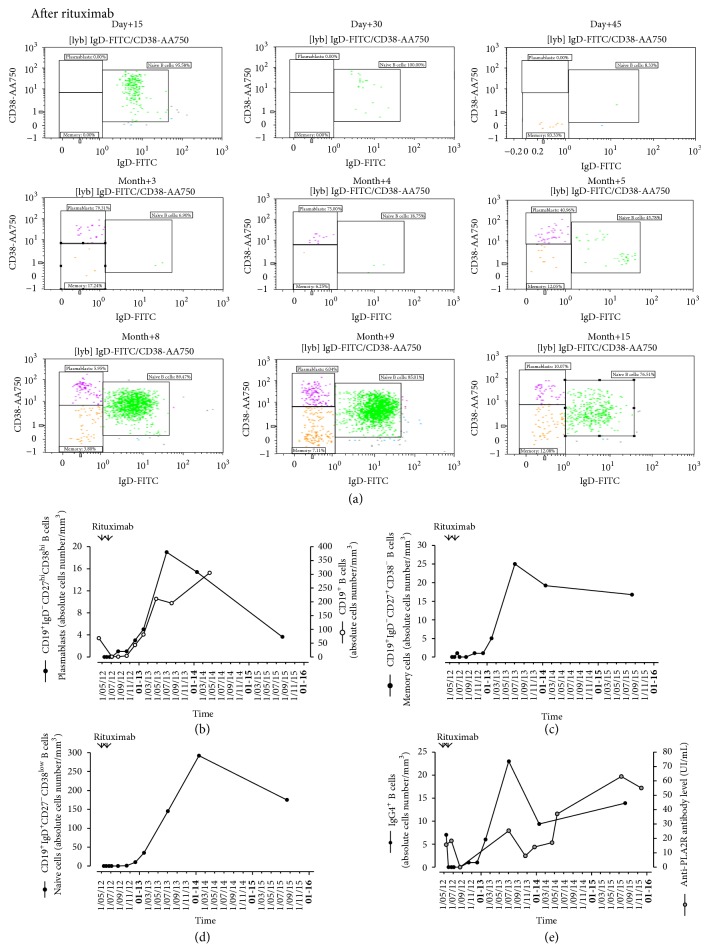
Figure 3.
Distribution of the B lymphocyte subpopulations after B cells depleting therapy with rituximab as evaluated by fluorescence-activated cell sorter (FACS) analysis of peripheral blood mononuclear cells (PBMC). (a) Dot-plots representing the expression of IgD (FITC) and CD38 (AA750) monitored in our patient with corticosteroid-resistant PLA2R1 related membranous nephropathy during 15 months after first rituximab injection. Graphs representing the kinetics of absolute cells number per mm3 of (b) plasmablasts (CD3−CD19+CD20−IgD−CD27highCD38high), (c) memory B cells (CD3−CD19+CD20+IgD−CD27+CD38−), and (d) naïve (CD3−CD19+CD20+IgD+CD27−CD38low) B cells. (e) IgG4+ B cells (absolute cells number per mm3) and anti-PLA2R1 antibody assessed in serum expressed in IU/mL.

