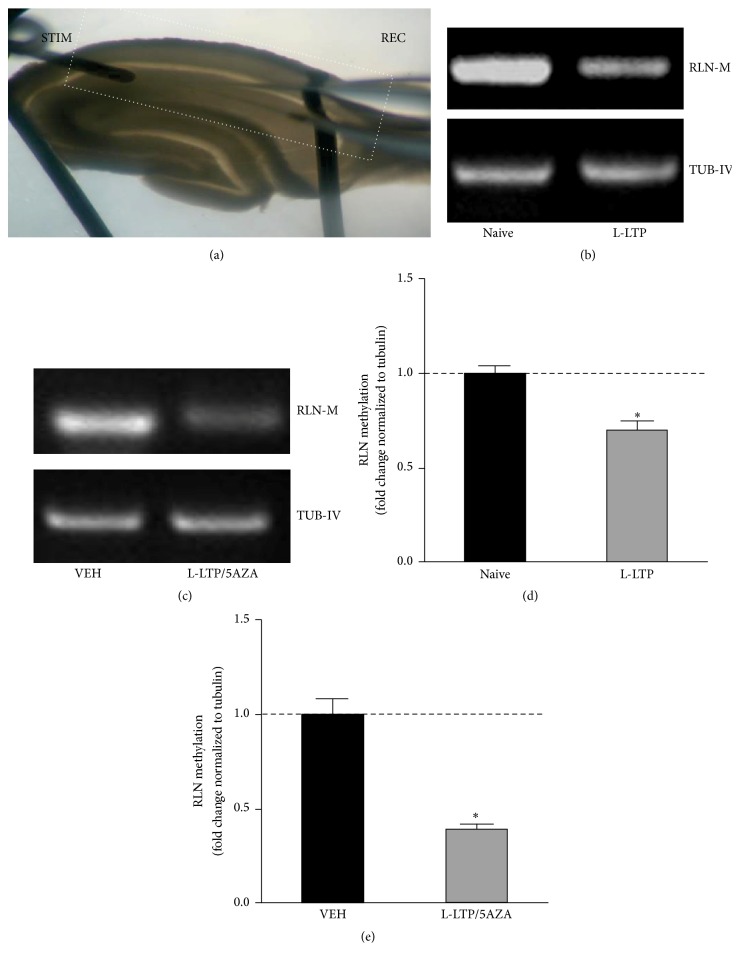
Figure 4.
The RLN gene was methylated two hours after TBS in both the absence and the presence of 5AZA. (a) A hippocampal section showing the placement of the stimulation electrode (STIM) and the recording electrode (REC) in the stratum radiatum layer of CA1. The white dotted line represents the area that was microdissected for MSP analysis. (b) Representative agarose gel electrophoresis showing the amount of DNA that was methylated in the tetanized slices relative to the level in the naive slices at two hours after TBS. (c) Quantification of the methylation of the RLN gene normalized to the level of tubulin for data such as that shown in (c). ∗ p < 0.05, n = 5, one-sample Mann-Whitney test. (d) Representative agarose gel electrophoresis showing methylated DNA levels in tetanized slices relative to the level in the vehicle at two hours after TBS in tissues incubated in the presence of 5AZA. (e) Quantification of the level of RLN gene methylation normalized to the level of tubulin methylation for data such as that shown in (c). ∗ p < 0.05, n = 3, one-sample Mann-Whitney test.

