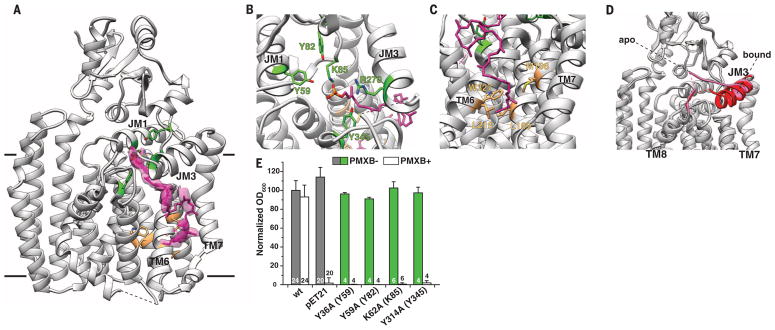
Fig. 3. Binding of undecaprenyl phosphate (UndP) to ArnTCm.
(A) Ribbon representation of the 3.2 Å resolution crystal structure of ArnTCm in complex with UndP. UndP was modeled based on densities present for the head group and tail of the molecule. The electron densities shown are from a 2Fobs – Fcalc omit map for the UndP contoured at 1 root mean square deviation (RMSD). (B) Close-up of the head group, with residues tested for functional significance shown in stick representation and colored by location (green for cavity 2) and heteroatom. (C) Close-up of the tail of UndP inserted into cavity 3. Residues shown in stick representation and colored by location (tan for cavity 3) and heteroatom have been tested for functional significance (see fig. S9). (D) Superposition of the apo and UndP-bound structures, where PL4 is colored pink for the apo structure and red for the UndP-bound state. The rearrangement of coil (apo) to helix (bound) shown here is the only substantial change between the two structures. (E) Functional significance of residues around the head group of UndP, tested by using a polymyxin B (PMXB) growth assay (13). Data presented are means + SD. N is shown for each data column.

