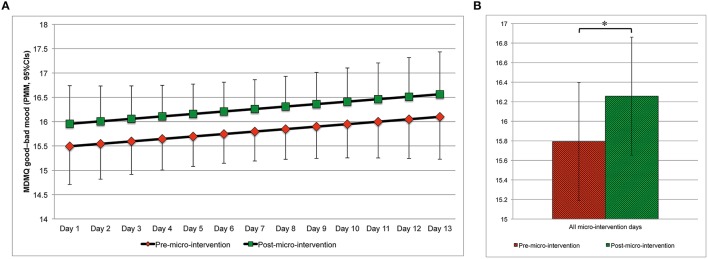
Figure 4.
Good–bad mood (predicted marginal means, 95%CIs) pre- and post-micro-intervention, by the micro-intervention day (A) and across all micro-intervention days (B). *b = 0.464, 95%CI: 0.068–0.860, t(613.3) = 2.298, p = 0.022; Higher values indicate better mood; In (A), for the pre-micro-intervention values, the lower boundaries of the 95%CIs are depicted, for the post-micro-intervention values, the upper boundaries of the 95%CIs are depicted; CI, confidence interval; MDMQ, Multidimensional Mood State Questionnaire; PMM, predicted marginal means.

