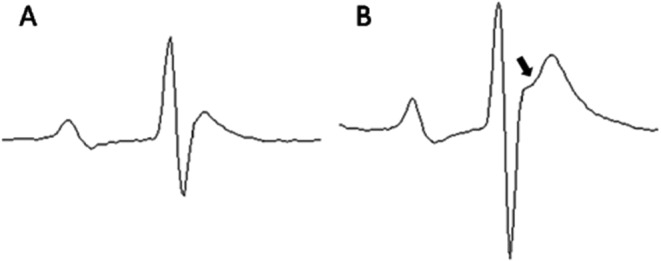
Fig. 2.

Representative averaged ECG traces before (A) and after (B) administration of CA4DP. A: Normal ECG of a rat before administration of CA4DP. The ST junction is not obvious. B: ECG of a rat after administration of CA4DP 50 mg/10 mL/kg. This trace was obtained 23 hours after the second administration of CA4DP 50 mg/10 mL/kg. In this ECG, the ST junction is obvious (arrow).
